Unlock a world of possibilities! Login now and discover the exclusive benefits awaiting you.
- Qlik Community
- :
- All Forums
- :
- QlikView App Dev
- :
- Re: Class with dates
- Subscribe to RSS Feed
- Mark Topic as New
- Mark Topic as Read
- Float this Topic for Current User
- Bookmark
- Subscribe
- Mute
- Printer Friendly Page
- Mark as New
- Bookmark
- Subscribe
- Mute
- Subscribe to RSS Feed
- Permalink
- Report Inappropriate Content
Class with dates
Hi Community:
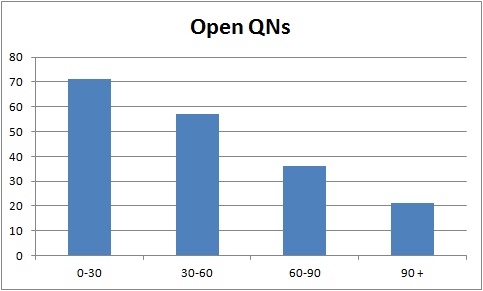
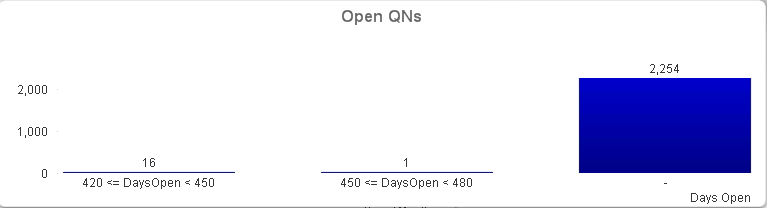
I am trying to make a chart that looks like the following:
Here is my data. I am using the OPEN_QN_FLG field from the QN table and SRC_CREATE_DTTM field from the Squawk table.
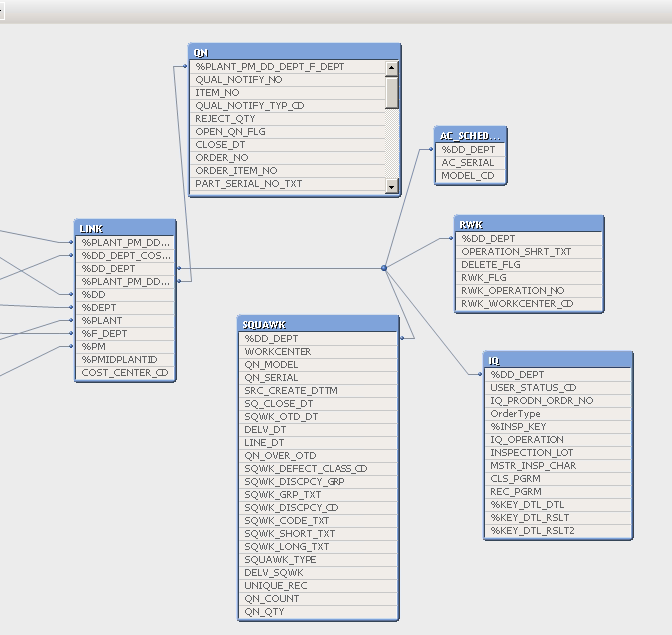
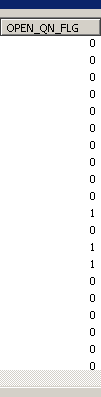
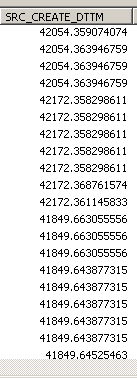
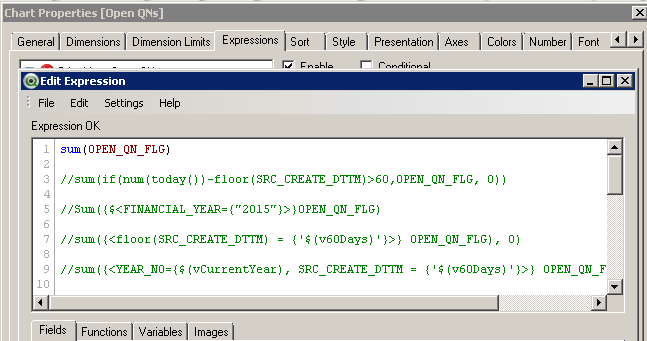
The SRC_CREATE_DTTM is in number format and is the date that the quality notification (QN) was opened. The OPEN_QN_FLG field shows a 1 if the notification is still opened, and a 0 if it is closed. For my chart, I am only interested in the open QNs, or 1s.
This is the chart I am getting, and can't figure out how to fix it:
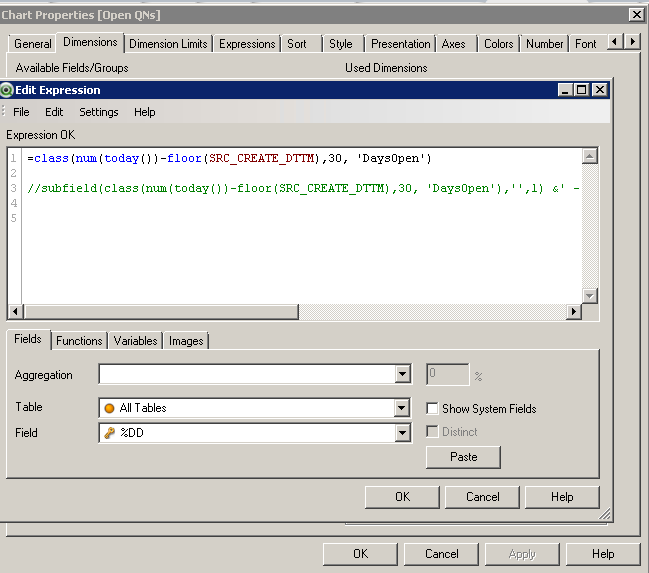
I commented out a lot of lines just because I have tried a lot of stuff and cannot get anything to work right. I put the num in front of TODAY so that it is in the same format as the SRC_CREATE_DTTM. Since the SRC_CREATE_DTTM has so many decimals, I used FLOOR in order to get rid of them.
I ideally do not want to change anything in the back end, if possible, because someone else is working on that as I design the front end. However, if that is the only option we can work together to add to that.
Thanks!
- Tags:
- qlikview_scripting
- « Previous Replies
-
- 1
- 2
- Next Replies »
- Mark as New
- Bookmark
- Subscribe
- Mute
- Subscribe to RSS Feed
- Permalink
- Report Inappropriate Content
Also, DaysOpen, in the CLASS function, is not a field, it is just the label that I used to name the classes
- Mark as New
- Bookmark
- Subscribe
- Mute
- Subscribe to RSS Feed
- Permalink
- Report Inappropriate Content
Channing,
use this expression in calculated dimension
replace(class(num(today)-floor(SRC_CREATE_DTTM),30,'x',0),'x','-')
30 - interval
'-' default string
0 is offset value (starting point)
you have to use a function named Replace(string, fromstring, tostring) to display '-' between the range values on x - axis.
- Mark as New
- Bookmark
- Subscribe
- Mute
- Subscribe to RSS Feed
- Permalink
- Report Inappropriate Content
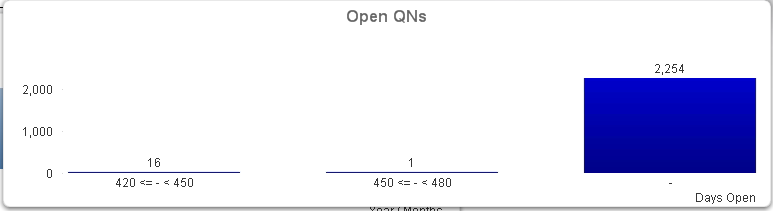
Above is what changed. DaysOpen was replaced with a hyphen. That did help, but now I need the buckets to be different values (0-30 days, 30-60 days, 60-90 days, 90+ days)
- Mark as New
- Bookmark
- Subscribe
- Mute
- Subscribe to RSS Feed
- Permalink
- Report Inappropriate Content
Hi Channing,
Please copy paste your calculated dimension here.
- Mark as New
- Bookmark
- Subscribe
- Mute
- Subscribe to RSS Feed
- Permalink
- Report Inappropriate Content
use this for '-' only between the range
replace(class(num(today)-floor(SRC_CREATE_DTTM),30,'x',0),'<= x <','-')
Probably the minimum number of days between today and SRC_CREATE_DTTM is 420, that's why the range is getting started with 420.
Please share the qvw file for better understanding.
- Mark as New
- Bookmark
- Subscribe
- Mute
- Subscribe to RSS Feed
- Permalink
- Report Inappropriate Content
=class(num(today())-floor(SRC_CREATE_DTTM),30, 'DaysOpen') is what I used originally
But then I changed it to what Anuj said, and then posted the new chart, after using =replace(class(num(today())-floor(SRC_CREATE_DTTM),30,'x',0),'x','-')
- Mark as New
- Bookmark
- Subscribe
- Mute
- Subscribe to RSS Feed
- Permalink
- Report Inappropriate Content
Hi,
Use '<= x <' instead of 'x'
=replace(class(num(today())-floor(SRC_CREATE_DTTM),30,'x',0),'<= x <','-')
As for Buckets - Maybe you have date for starting 420 days and more.
- Mark as New
- Bookmark
- Subscribe
- Mute
- Subscribe to RSS Feed
- Permalink
- Report Inappropriate Content
So I made a change. I ended up adding something to the back end. I added a field called AGE which subtracts the create date and today's date, so the column shows the number of days the quality notification has been opened. Now, my dimension is this: =replace(class(AGE,30,'x'),'<= x <','-') and that is labeled Age Group. My expression is sum(OPEN_QN_FLG).
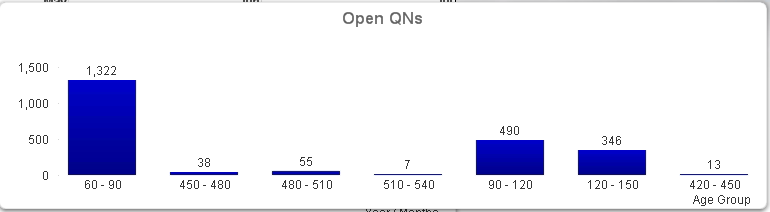
I feel like I'm getting closer, but I only want 4 bars being 0-30, 30-60, 60-90, 90+.
How do I specify this?
- Mark as New
- Bookmark
- Subscribe
- Mute
- Subscribe to RSS Feed
- Permalink
- Report Inappropriate Content
never mind! I figured it out
- « Previous Replies
-
- 1
- 2
- Next Replies »