Unlock a world of possibilities! Login now and discover the exclusive benefits awaiting you.
- Qlik Community
- :
- All Forums
- :
- QlikView App Dev
- :
- Re: Create chart with two axis
- Subscribe to RSS Feed
- Mark Topic as New
- Mark Topic as Read
- Float this Topic for Current User
- Bookmark
- Subscribe
- Mute
- Printer Friendly Page
- Mark as New
- Bookmark
- Subscribe
- Mute
- Subscribe to RSS Feed
- Permalink
- Report Inappropriate Content
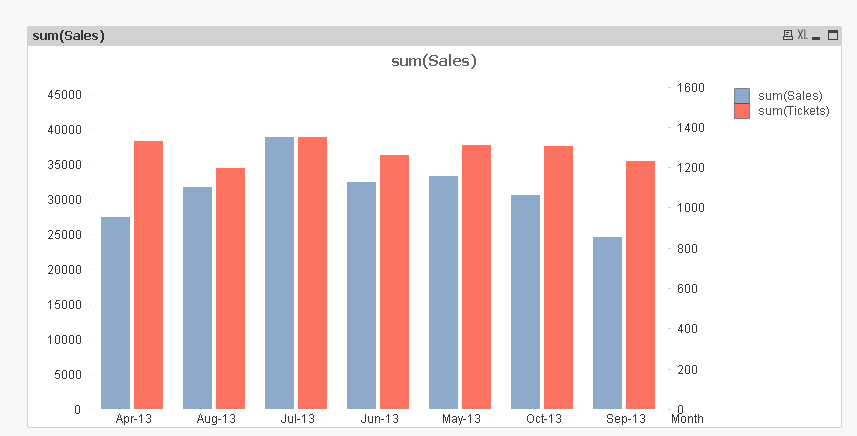
Create chart with two axis
Hi All,
How to create two axis bar chart like below.
PFA
Thanks
- « Previous Replies
-
- 1
- 2
- Next Replies »
- Mark as New
- Bookmark
- Subscribe
- Mute
- Subscribe to RSS Feed
- Permalink
- Report Inappropriate Content

- Mark as New
- Bookmark
- Subscribe
- Mute
- Subscribe to RSS Feed
- Permalink
- Report Inappropriate Content
with this key word , as per my knowledge we don't have i guess. Are you looking for the Dimension labels(in Dimension tab) or Expression Lables(in expression tab)
- Mark as New
- Bookmark
- Subscribe
- Mute
- Subscribe to RSS Feed
- Permalink
- Report Inappropriate Content
Avinash R wrote:
In the properties of your chart there is a tab labeled Axes. In this tab will be a box labeled the "Expression Axes" (similar to a Y Axis) and here you can select which Expressions you want to have on the Axes and which you don't by selecting the expression and checking or unchecking the box labeled "Hide Axis".
I think you are looking for the chart properties tab labelled 'Axes'. But I don't know what to add to above posts.
In general, what you are trying to do should be done using the options you already discovered looking at your screenshot, maybe just with different combinations.
To tell you more, please post a small sample QVW.
- Mark as New
- Bookmark
- Subscribe
- Mute
- Subscribe to RSS Feed
- Permalink
- Report Inappropriate Content
hi check this.
- Mark as New
- Bookmark
- Subscribe
- Mute
- Subscribe to RSS Feed
- Permalink
- Report Inappropriate Content
can you post the qvw in question - I believe with the screen sample you provided along with the applciation, it will be better understood what you are looking for or what the problem is.
Typically all you should have to do, as was stated earlier is to select bottom right for the other expression, and do not believe you need to select split axis
- Mark as New
- Bookmark
- Subscribe
- Mute
- Subscribe to RSS Feed
- Permalink
- Report Inappropriate Content
I made a slight modification to the chart to showm how it would look with a bar and a line on a combo chart with the 2 different axis
- Mark as New
- Bookmark
- Subscribe
- Mute
- Subscribe to RSS Feed
- Permalink
- Report Inappropriate Content
Hi Adam,
Thanks for your help but still i am not getting my requirement.
PFA in that i want growth from right side axis as mention in attachment.
growth is ((TY-PY)/PY)*100
Thanks...
- Mark as New
- Bookmark
- Subscribe
- Mute
- Subscribe to RSS Feed
- Permalink
- Report Inappropriate Content
Dear All,
I want values on X-axis and Growth on Y-axis with two years data.
Thanks
- Mark as New
- Bookmark
- Subscribe
- Mute
- Subscribe to RSS Feed
- Permalink
- Report Inappropriate Content
Here you go with your two axis. If you want to see the second axis, you should
- assign your first two expression both to the left axis, third (percentage) to the right
- not customize the drawing area to be enlarged so that right axis isn't shown.
In doubt when creating a chart, start from scratch by creating a new chart, don't try to fiddle around with a chart you already have customized / modified a lot.
Seems like you implicitely have a lot of other requests, like calculating your measures or filtering the data accordingly.
I'm off for these.
- « Previous Replies
-
- 1
- 2
- Next Replies »