Unlock a world of possibilities! Login now and discover the exclusive benefits awaiting you.
- Qlik Community
- :
- All Forums
- :
- QlikView App Dev
- :
- Data-comparision
- Subscribe to RSS Feed
- Mark Topic as New
- Mark Topic as Read
- Float this Topic for Current User
- Bookmark
- Subscribe
- Mute
- Printer Friendly Page
- Mark as New
- Bookmark
- Subscribe
- Mute
- Subscribe to RSS Feed
- Permalink
- Report Inappropriate Content
Data-comparision
Hi dear Community,
i have a comparison-data-load-problem. I must load monthly project-data in form of excel-files.Therefor i must compare the field "actual cost" with each file. so for example i have the month July and June. In June the actual cost was about 1000 $ and in July about 1500$ dollar. So when i add loading the new monthly excel-file for July, then the programm should replace the old fieldvalue of actual cost(from June) which was about 1000$ and should set an new fieldvalue with the new value of 1500$.
Can i anybody help me please by solving my problem?
- « Previous Replies
- Next Replies »
- Mark as New
- Bookmark
- Subscribe
- Mute
- Subscribe to RSS Feed
- Permalink
- Report Inappropriate Content
Following scenarion insert and update and delete in existing QVD.
Load * From NewData;
concatenate
Load * from Historicaldata
where not exist (PKey);
- Mark as New
- Bookmark
- Subscribe
- Mute
- Subscribe to RSS Feed
- Permalink
- Report Inappropriate Content
oh,
thank you sunil jain for your suggestion.
Regards
Dilan
- Mark as New
- Bookmark
- Subscribe
- Mute
- Subscribe to RSS Feed
- Permalink
- Report Inappropriate Content
Dear Bhushan,
thank you very much for helping me again and again...i will try this way you suggest, i hope it will function:)
Thank you!
Cheers,
Dilan
- Mark as New
- Bookmark
- Subscribe
- Mute
- Subscribe to RSS Feed
- Permalink
- Report Inappropriate Content
Hi Bhushan,
again it´s me:)
So 1) where must i insert my expression that i´m creating ( by the "script" option?)
2) after i have create an expression like for example (if projectcost actual- projectcost plan<1000) where must i insert the chart? is the chart independent of the expression or are they coherent?
3) i´m not sure with the linking up between the expression i create and the chart i create
perhaps you can help me on?
cheers
Dilan
- Mark as New
- Bookmark
- Subscribe
- Mute
- Subscribe to RSS Feed
- Permalink
- Report Inappropriate Content
Hi Dilan ,
check this one .
Regards,
Bhushan N
- Mark as New
- Bookmark
- Subscribe
- Mute
- Subscribe to RSS Feed
- Permalink
- Report Inappropriate Content
hi again:)
I try this way:
after the loading order (by scripting) i set a order like : let a=projectcost_actual - projectcost_plan ( to get the difference between these both values)
then i set the properties for the expressions, for the chart like this:
a) Label "Difference" express the field "a", so i enter this " sum($a)" ( i write this by the "Definition of the Label"
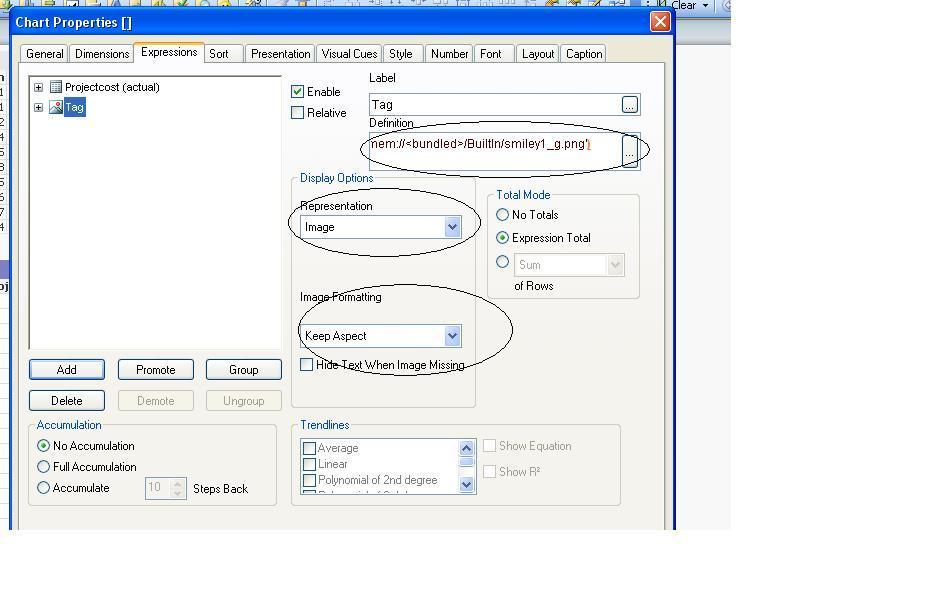
b) Label "Tag" expresses the Red, yellow or green status by this definition ( and i save this as a image like you show me)
if (a <= 1000, 'qmem://<bundled>/BuiltIn/exclamation_r.png')
xor
if (a >1000,'qmem://<bundled>/BuiltIn/exclamation_y.png')
so i have now the problem, that the difference between the field values doesn´t apperar in the chart and that the Tag doesn´t appear in the right color
have you got a idea to solve this problems?
Thank you very much for helping:)
cheers
dilan
- « Previous Replies
- Next Replies »