Unlock a world of possibilities! Login now and discover the exclusive benefits awaiting you.
- Qlik Community
- :
- All Forums
- :
- QlikView App Dev
- :
- Re: Bar Chart Overlap
- Subscribe to RSS Feed
- Mark Topic as New
- Mark Topic as Read
- Float this Topic for Current User
- Bookmark
- Subscribe
- Mute
- Printer Friendly Page
- Mark as New
- Bookmark
- Subscribe
- Mute
- Subscribe to RSS Feed
- Permalink
- Report Inappropriate Content
Bar Chart Overlap
Hi All,
I create a bar chart with Agent as a dimension and Referrals ,Ai, Closed, Declined are expressions(these are related to agent).In style I selected stacked view it is displaying as shown in image every bar is just added to below bar I don't want to display like that.
every expression bar has to be start from 'o'.
Please anyone help me. It's an urgent requirement in my project.
Thanks in advance
Thanks
Anusha K
- « Previous Replies
-
- 1
- 2
- Next Replies »
- Mark as New
- Bookmark
- Subscribe
- Mute
- Subscribe to RSS Feed
- Permalink
- Report Inappropriate Content
Maybe just change the style to grouped?
- Mark as New
- Bookmark
- Subscribe
- Mute
- Subscribe to RSS Feed
- Permalink
- Report Inappropriate Content
Hi Anusha,
I think buy using combo chart to display two expression,
But i don't know three expressions
- Mark as New
- Bookmark
- Subscribe
- Mute
- Subscribe to RSS Feed
- Permalink
- Report Inappropriate Content
Hi swuehl,
Thanks for ur reply but want to display in stacked view only
- Mark as New
- Bookmark
- Subscribe
- Mute
- Subscribe to RSS Feed
- Permalink
- Report Inappropriate Content
Thankyou ramanjaneyulu but I need to display in stacked view of barchart only with 4 expressions
- Mark as New
- Bookmark
- Subscribe
- Mute
- Subscribe to RSS Feed
- Permalink
- Report Inappropriate Content
Hi anusha,
in my knowledge of qlikview that is not possible directly
- Mark as New
- Bookmark
- Subscribe
- Mute
- Subscribe to RSS Feed
- Permalink
- Report Inappropriate Content
Maybe I just don't understand what you want as result. Could you post a sketch of the desired outcome?
- Mark as New
- Bookmark
- Subscribe
- Mute
- Subscribe to RSS Feed
- Permalink
- Report Inappropriate Content
Hi swuehl,
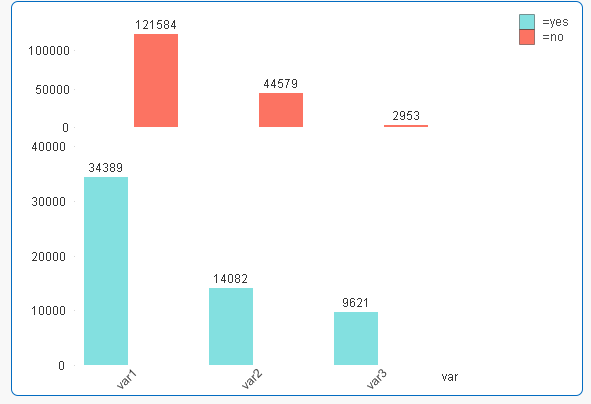
I want the result like in below image.
- Mark as New
- Bookmark
- Subscribe
- Mute
- Subscribe to RSS Feed
- Permalink
- Report Inappropriate Content
Hi,
I have a play and like thought it is not possible as standard, You maybe able to acheive this by overlapping graphs on top of each other, but highly unlikely due to figures not always suiting this, i.e. highest values at the back. An extension object made be able to be built to do this, but again there would be issues with ordering.
Mark
- Mark as New
- Bookmark
- Subscribe
- Mute
- Subscribe to RSS Feed
- Permalink
- Report Inappropriate Content
I think you need to manipulate your expressions, that first expression is
=Sum(Field1)
second:
=Dual(Sum(Field2), Sum(Field2) -Sum(Field1) )
third:
=Dual(Sum(Field3), Sum(Field3) -Sum(Field2) -Sum(Field1) )
etc.
You'll need to ensure that first expression results always in value < second expression, and second is always smaller than third etc.
- « Previous Replies
-
- 1
- 2
- Next Replies »