Unlock a world of possibilities! Login now and discover the exclusive benefits awaiting you.
- Qlik Community
- :
- All Forums
- :
- QlikView App Dev
- :
- Expression Issue Help !
- Subscribe to RSS Feed
- Mark Topic as New
- Mark Topic as Read
- Float this Topic for Current User
- Bookmark
- Subscribe
- Mute
- Printer Friendly Page
- Mark as New
- Bookmark
- Subscribe
- Mute
- Subscribe to RSS Feed
- Permalink
- Report Inappropriate Content
Expression Issue Help !
Ho Folks,
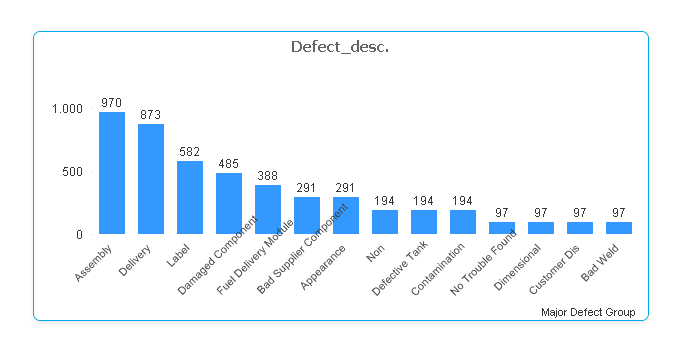
I'm not sure if this is because of my data model , but I'm facing issue with below bar chart.

Instead of showing all Defect_Desc. , bar is only showing "Appearance".
Dimension: =if(Month<>Month(today()),SubField(Defect_Description,'-',1))
Expression:
sum(aggr(Sum({<Complaint_Acceptance-={4,5,6,7}>} QTY_PPM*Top_Pos_Flag) /
(Sum ({<Complaint_Type = {1, 3}>} QTY_Delivered_TOTAL) + Sum ({<Complaint_Type = {2, 7}>} QTY_Received_TOTAL)) *1000000,%MANDANT_Key))
Kindly help!
Thanks,
AS
- Tags:
- qlikview_scripting
- « Previous Replies
-
- 1
- 2
- Next Replies »
- Mark as New
- Bookmark
- Subscribe
- Mute
- Subscribe to RSS Feed
- Permalink
- Report Inappropriate Content
Could you post your qvw with sample data?
- Mark as New
- Bookmark
- Subscribe
- Mute
- Subscribe to RSS Feed
- Permalink
- Report Inappropriate Content
Try Calculated Dimension as below
Aggr(if(Month<>Month(today()),SubField(Defect_Description,'-',1)),Defect_Description)
- Mark as New
- Bookmark
- Subscribe
- Mute
- Subscribe to RSS Feed
- Permalink
- Report Inappropriate Content
I would probably not use this kind of calculated dimension and adjust and/or split the field Defect_Description within the script and put the condition within the expression maybe like this:
Date = {"<date(monthstart(today(), 'YourFormat')"}
Further I would use rangesum(sum1, sum2) instead of sum1 + sum2 and maybe a further alt() to catch possible NULL or errors.
- Marcus
- Mark as New
- Bookmark
- Subscribe
- Mute
- Subscribe to RSS Feed
- Permalink
- Report Inappropriate Content
Hi Tresesco,
PFA
Thanks,
AS
- Mark as New
- Bookmark
- Subscribe
- Mute
- Subscribe to RSS Feed
- Permalink
- Report Inappropriate Content
Hi Manish,
Same issue 
Thanks,
AS
- Mark as New
- Bookmark
- Subscribe
- Mute
- Subscribe to RSS Feed
- Permalink
- Report Inappropriate Content
Does this look like something you want?
I added NODISTINCT to the expression:
=Sum(Aggr(NODISTINCT Sum({<Complaint_Acceptance-={4,5,6,7}>} QTY_PPM*Top_Pos_Flag) /
(Sum ({<Complaint_Type = {1, 3}>} QTY_Delivered_TOTAL) + Sum ({<Complaint_Type = {2, 7}>} QTY_Received_TOTAL)) *1000000,%MANDANT_Key))
- Mark as New
- Bookmark
- Subscribe
- Mute
- Subscribe to RSS Feed
- Permalink
- Report Inappropriate Content
Hi Sunny,
No!
Sum out of bars should be 97.
Thanks,
AS
- Mark as New
- Bookmark
- Subscribe
- Mute
- Subscribe to RSS Feed
- Permalink
- Report Inappropriate Content
You mean if we sum all the bars it would total to 97?
- Mark as New
- Bookmark
- Subscribe
- Mute
- Subscribe to RSS Feed
- Permalink
- Report Inappropriate Content
Yes!
- « Previous Replies
-
- 1
- 2
- Next Replies »