Unlock a world of possibilities! Login now and discover the exclusive benefits awaiting you.
- Qlik Community
- :
- All Forums
- :
- QlikView App Dev
- :
- Re: Hi guys, how can we create a chart (bar chart)...
- Subscribe to RSS Feed
- Mark Topic as New
- Mark Topic as Read
- Float this Topic for Current User
- Bookmark
- Subscribe
- Mute
- Printer Friendly Page
- Mark as New
- Bookmark
- Subscribe
- Mute
- Subscribe to RSS Feed
- Permalink
- Report Inappropriate Content
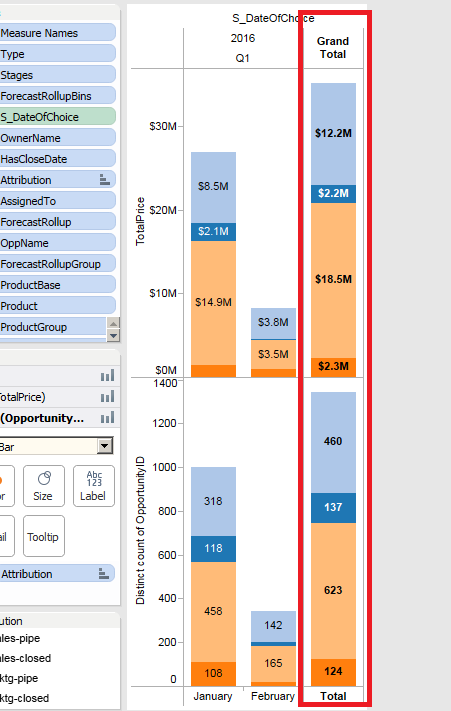
Hi guys, how can we create a chart (bar chart) with Grand total (please see the sample screenshot below)
- Mark as New
- Bookmark
- Subscribe
- Mute
- Subscribe to RSS Feed
- Permalink
- Report Inappropriate Content
There is an option in Chart Property in Dimension Limit tab.
Chart Property->Dimension Limit tab->
Option Group Box
Check The Show Total Checkbox and label it
- Mark as New
- Bookmark
- Subscribe
- Mute
- Subscribe to RSS Feed
- Permalink
- Report Inappropriate Content
Thanks Nishit but, the new bar added is not segmented.
- Mark as New
- Bookmark
- Subscribe
- Mute
- Subscribe to RSS Feed
- Permalink
- Report Inappropriate Content
I think you need to add these TOTAL as an additionally dimension-value and respect this within your expression. This could be done with a calculated dimension like:
=valuelist($(=concat(distinct Month, ',')), 'Total')
and as expression someting like:
pick(match(valuelist($(=concat(distinct Month, ',')), 'Gesamt'), 1,2,3,4,5,6,7,8,9,10,11,12,'Gesamt'),
sum({< Monat = {1}>} [YourKPI]),
sum({< Month = {2}>} [YourKPI]),
sum({< Month = {3}>} [YourKPI]),
sum({< Month = {4}>} [YourKPI]),
sum({< Month = {5}>} [YourKPI]),
sum({< Month = {6}>} [YourKPI]),
sum({< Month = {7}>} [YourKPI]),
sum({< Month = {8}>} [YourKPI]),
sum({< Month = {9}>} [YourKPI]),
sum({< Month = {10}>} [YourKPI]),
sum({< Month = {11}>} [YourKPI]),
sum({< Month = {12}>} [YourKPI]),
sum({< Month = p(Month)>} [YourKPI]))
You might need some small adjustments to respect the year and/or a switch over a year or similar. But if add (per concatenate) these TOTAL within the script, maybe in an parallel field only for these purpose it would be easier to handle within the gui because you need only to query if your dimension-value is TOTAL or not.
- Marcus
- Mark as New
- Bookmark
- Subscribe
- Mute
- Subscribe to RSS Feed
- Permalink
- Report Inappropriate Content
thanks for the tips, but I'm using an cyclic group type of date. To drill down different dates.
how can I apply it to a cyclic type date
Thanks
Don
- Mark as New
- Bookmark
- Subscribe
- Mute
- Subscribe to RSS Feed
- Permalink
- Report Inappropriate Content
You could use the same approach like above with several calculated dimensions in a dimension group, like:
=valuelist($(=concat(distinct Date, ',')), 'Total') //Date
=valuelist($(=concat(distinct Week, ',')), 'Total') //Week
=valuelist($(=concat(distinct Month, ',')), 'Total') //Month
=valuelist($(=concat(distinct Year, ',')), 'Total') //Year
and the expression will be a bit longer and queried which dimension from the group is active:
pick(match(subfield(getcurrentfield(YourDimensionGroupName), '//', 2), 'Date', 'Week', 'Month', 'Year'),
..., // pick(match() expression like above only per Date or maybe on DAY
pick(match(valuelist($(=concat(distinct Month, ',')), 'Gesamt'), 1,2,3,4,5,6,7,8,9,10,11,12,'Gesamt'),
sum({< Monat = {1}>} [YourKPI]),
sum({< Month = {2}>} [YourKPI]),
sum({< Month = {3}>} [YourKPI]),
sum({< Month = {4}>} [YourKPI]),
sum({< Month = {5}>} [YourKPI]),
sum({< Month = {6}>} [YourKPI]),
sum({< Month = {7}>} [YourKPI]),
sum({< Month = {8}>} [YourKPI]),
sum({< Month = {9}>} [YourKPI]),
sum({< Month = {10}>} [YourKPI]),
sum({< Month = {11}>} [YourKPI]),
sum({< Month = {12}>} [YourKPI]),
sum({< Month = p(Month)>} [YourKPI])),
..., // pick(match() expression like above only per Week
...) // pick(match() expression like above only per Year
Not extremly nice but it should work. You should also consider to use several charts each specialized to a certain dimension or other things to keep the things simpler - maybe within a container and/or nested containers.
- Marcus
- Mark as New
- Bookmark
- Subscribe
- Mute
- Subscribe to RSS Feed
- Permalink
- Report Inappropriate Content
Thanks Guys
I already got it
- Mark as New
- Bookmark
- Subscribe
- Mute
- Subscribe to RSS Feed
- Permalink
- Report Inappropriate Content
If your question is now answered, please flag the Correct Answer and possible helpful answers.
If not, please let us know with which part of this topic we can still help you  .
.