Unlock a world of possibilities! Login now and discover the exclusive benefits awaiting you.
- Qlik Community
- :
- All Forums
- :
- QlikView App Dev
- :
- Re: working fine with straight table but not with ...
- Subscribe to RSS Feed
- Mark Topic as New
- Mark Topic as Read
- Float this Topic for Current User
- Bookmark
- Subscribe
- Mute
- Printer Friendly Page
- Mark as New
- Bookmark
- Subscribe
- Mute
- Subscribe to RSS Feed
- Permalink
- Report Inappropriate Content
working fine with straight table but not with kpi's charts
Hello All,
What making me confuse is i am using same dimension and same expression in two diff charts (kpis,straight table),but i am getting two diff results
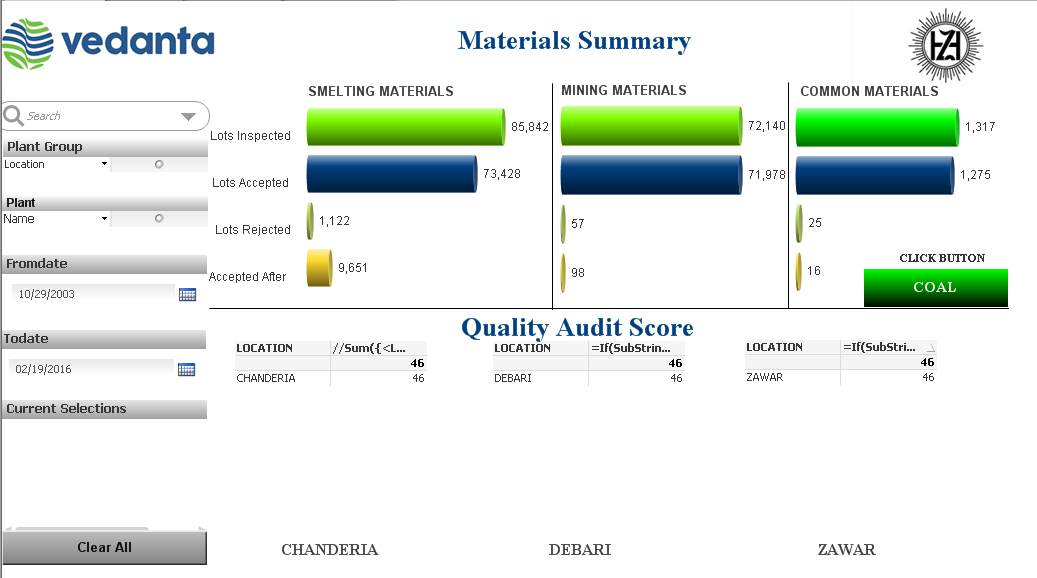
i mean ..my default when end user open dashboard he as to see all the location aduit score ...which is working fine in both table chart and kpi chart ....
if he goes feather and select only particular location from the drop down then he should only see that selected location with score ...
which is working great in table but its not working in kpis charts,
what i looking is when i select location, only selected KPI chart has to show the value the rest kpi chart needle should be at zero....
straight table:
dimension:LOCATION
expression:Sum({<ADATE={"$(=max(ADATE))"}>}OVERALL_SCR)(working fine)
kpi chart:(chanderia kpi chart)
dimension:LOCATION
expression:Sum({<LOCATION={'CHANDERIA'},ADATE={"$(=max(ADATE))"}>}OVERALL_SCR)
Help me in resloving this task,
Please find the attachment(data screen short)
thanks
naveen
- Mark as New
- Bookmark
- Subscribe
- Mute
- Subscribe to RSS Feed
- Permalink
- Report Inappropriate Content
surprise how come its not working over here ,u might have done some magic......
wat expression have u written in them
by default r u getting three location score? before selection either of them
- Mark as New
- Bookmark
- Subscribe
- Mute
- Subscribe to RSS Feed
- Permalink
- Report Inappropriate Content
I have added the application with my previous post. Expressions I used are:
1) =If(SubStringCount(Concat(DISTINCT LOCATION, ', '), 'DEBARI') = 1, Sum({<LOCATION = {'DEBARI'}, ADATE ={"$(=Max(ADATE))"}>} OVERALL_SCR), 0)
2) =If(SubStringCount(Concat(DISTINCT LOCATION, ', '), 'ZAWAR') = 1, Sum({<LOCATION = {'ZAWAR'}, ADATE ={"$(=Max(ADATE))"}>} OVERALL_SCR), 0)
These are the exact same ones you shared earlier
- Mark as New
- Bookmark
- Subscribe
- Mute
- Subscribe to RSS Feed
- Permalink
- Report Inappropriate Content
sunny ,see the default thing is working only for chanderia but not the other location which is showing zero before selection but the chanderia showing the value before ...... have u seen that
- Mark as New
- Bookmark
- Subscribe
- Mute
- Subscribe to RSS Feed
- Permalink
- Report Inappropriate Content
default page after using those expression.........................
- Mark as New
- Bookmark
- Subscribe
- Mute
- Subscribe to RSS Feed
- Permalink
- Report Inappropriate Content
Ya I am seeing it. Checking it now
- Mark as New
- Bookmark
- Subscribe
- Mute
- Subscribe to RSS Feed
- Permalink
- Report Inappropriate Content
I am seeing the same issue, but what amazes me is the fact that if I convert the gauge chart into a straight table, it seems to be work as we would expect
Not sure why the gauge chart isn't working, but I can look for alternatives
- Mark as New
- Bookmark
- Subscribe
- Mute
- Subscribe to RSS Feed
- Permalink
- Report Inappropriate Content
Found the problem. You need to remove the LOCATION from dimension. Check out the attached 
- Mark as New
- Bookmark
- Subscribe
- Mute
- Subscribe to RSS Feed
- Permalink
- Report Inappropriate Content
Wow SUNNY,
finally we got that ,thanks very very much ,appreciated your work
thanks
naveen
- Mark as New
- Bookmark
- Subscribe
- Mute
- Subscribe to RSS Feed
- Permalink
- Report Inappropriate Content
No problem brother.
- Mark as New
- Bookmark
- Subscribe
- Mute
- Subscribe to RSS Feed
- Permalink
- Report Inappropriate Content
Hello sunny ,
when ever u get a chance can u please explain me how this expression is working.....specially the bold letters one when should i need to use ....
please
=If(SubStringCount(Concat(DISTINCT LOCATION, ', '), 'DEBARI') = 1, Sum({<LOCATION = {'DEBARI'}, ADATE ={"$(=Max(ADATE))"}>} OVERALL_SCR), 0)
thanks
naveen