Unlock a world of possibilities! Login now and discover the exclusive benefits awaiting you.
- Qlik Community
- :
- Blogs
- :
- Technical
- :
- Design
- :
- Master Items
- Subscribe to RSS Feed
- Mark as New
- Mark as Read
- Bookmark
- Subscribe
- Printer Friendly Page
- Report Inappropriate Content
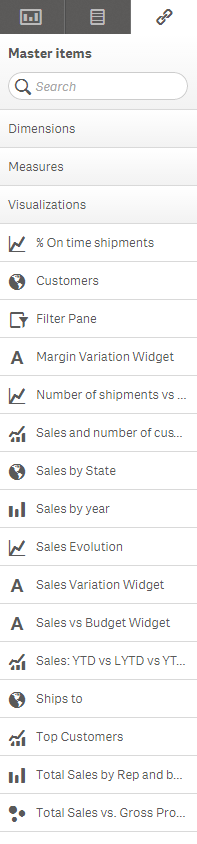
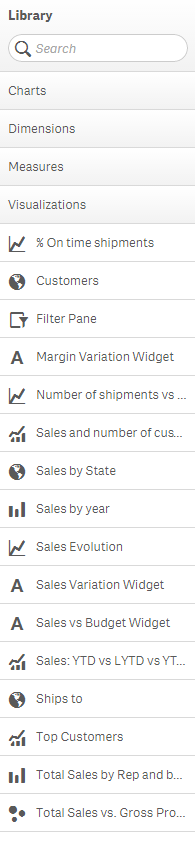
One of my favorite features of Qlik Sense is the ability to create and reuse Master Items. Master Items (seen in the image on the left) are dimensions, measures and visualizations that have been saved in the Asset panel in a Qlik Sense app. During the development process, Master Items can be used to create visualizations and once the app is published, the Master Items are available in the Library panel (seen in the image on the right) for others to use.
When creating apps, it is common to use the same dimensions and/or measure in more than one chart – that is why Master Items are so useful. I can create a Master Item measure such as Sales (Sum([Sales Amount])) and then use this measure in multiple charts. I do not need to copy and paste the measure every time I need to use it. All I need to do is drag it to my chart or select it from the list of measures. If I decide that I need to make a change to the measure, all I have to do is edit the measure in the Master Items and the change will be made anywhere the measure is used. This saves time and keeps the app/measures consistent. The same can be done with dimensions that are used often in an app. Create it once and use it wherever needed. The Asset panel also has an area for visualizations that can be created by the developer and saved giving users the ability to drag a pre-made visualization to their sheet. In this blog, I will focus on the dimensions and measures section of the Master Items.
There are a few ways you can create a Master Item. Let’s first take a look at how you can create a dimension. There are three ways you can create a dimension.
- From the Fields section in the Asset panel
- From the Master Items section in the Asset panel
- From the Data Model Viewer
For a closer look at how to create dimension, check out this documentCreating Dimensions and Measures.
Measure can be created in a similar way as the dimensions.
- From the Fields section in the Asset panel
- From the Master Items section in the Asset panel
- From the Data Model Viewer
For a closer look at how to create measures, check out this documentCreating Dimensions and Measures.
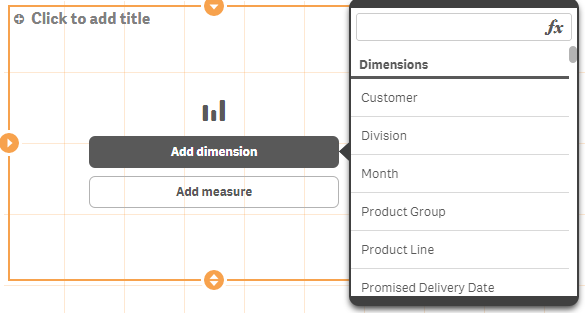
Once the dimensions and measures are created, they can be used to create visualizations. When you are prompted to add a dimension or a measure to a chart, the dimensions and measures that were added to the Master Items will be listed first.
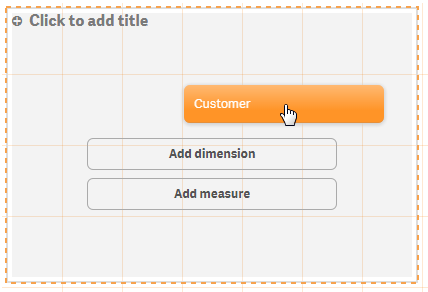
Here is what you see when prompted to add a dimension:
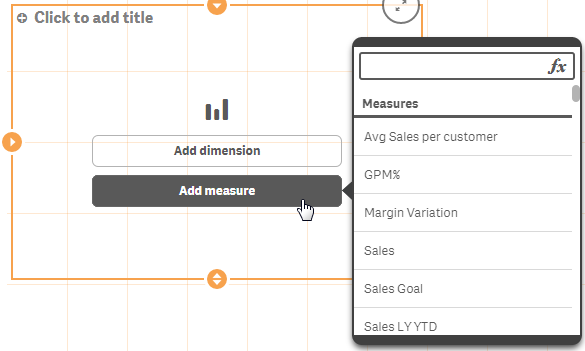
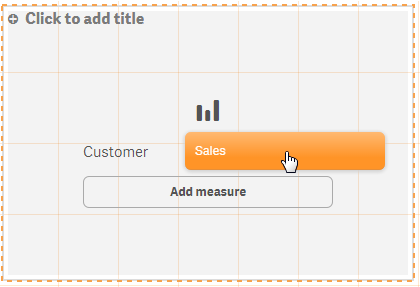
Here is what you see when prompted to add a measure:
You can simply select the dimension/measure or you can drag the dimension/measure from the Master Items section to the chart.
Dragging Customer dimension to a bar chart:
Dragging Sales measure to a bar chart:
If you find the need to edit or change a dimension and/or measure, you can make the change in the Edit window and save. This change will be applied to all charts using the dimension and/or measure. So no more copying and pasting a measure change to all charts using the measure. This also ensures that the dimension and/or measure is updated consistently throughout the app.
Once the app is published, users can make use of the dimensions and measures in the Library to build their own visualizations or to edit existing visualizations. The user can drag and drop the dimensions and measures onto their charts and they do not need to worry about the expression or syntax because it is already done for them.
As you can hopefully see, it is very easy to add dimensions and measures to the Master Items and by taking the time to do so before creating your charts will prove to be quite valuable. Not only will it save you time when developing because of the reuse capabilities, it will aid you in creating a clean app that is consistent and easy to maintain. Once the app is published, it provides users self-service capabilities to build their own visualizations. If you do not create Master Items, I recommend you start. It is a great feature that in the end makes your job as the developer easier.
Thanks,
Jennell
- « Previous
-
- 1
- 2
- Next »
You must be a registered user to add a comment. If you've already registered, sign in. Otherwise, register and sign in.