Unlock a world of possibilities! Login now and discover the exclusive benefits awaiting you.
- Qlik Community
- :
- Blogs
- :
- Technical
- :
- Design
- :
- Don't get aggr()avated using aggr()
- Subscribe to RSS Feed
- Mark as New
- Mark as Read
- Bookmark
- Subscribe
- Printer Friendly Page
- Report Inappropriate Content
Hi guys, in this video edition of the Qlik Design Blog, I cover a well known but often misunderstood chart function known as Aggr(). Aggr() is used in advanced calculations when you need to make a second aggregation based on the result of the first. Such as which customer in which country had the most orders. Note that in combination with AGGR you can also use the FirstSortedValue() function with your aggregated measure as an argument, in order to display the dimension along with the aggregated measure. I provided examples below. Enjoy!
Let's Break It Down
Spotting the difference and piecing it all together so you can see how it works is a great way to internalize the function. This can be done with either Qlik Sense or QlikView. I put this together in a manner that allows you to see the breakdown of how aggr() works in conjunction with the video.
Which customers had the most orders?
- Use a table object
- Add Customer as dimension
- Add Count(OrderID) as measure
- In the table click the header column to sort - Descending - Customer on top had the most orders
Which countries had the most orders?
- Use a table object
- Add Country as dimension
- Add Count(OrderID) as measure
- In the table click the header column to sort - Descending - Country on top had the most orders
Which customers, in what countries has the most orders?
- Create a table object
- Add Country as dimension
- Add Customer as dimension
- Add Count(OrderID) as measure
- Hmmmm.... that's not right - it shows me the number of orders within each customer for each country, not the most.
- Ah - if I use Aggr() with my expression - I can use the Max() aggregation to get the most of the order count for each customer as in:
- max(aggr(Count(OrderID),Country,CustomerName)
BONUS Feature: FirstSortedValue()
- But how do I display the corresponding customer value in that country?
If I just use Country in the table, the results are similar to my previous example and are not correct.- Ah - if I create a measure using the FirstSortedValue() function along with my aggr() expression I can display the Max customer in that country in my table.
- FirstSortedValue(CustomerName,-Aggr(Count(DISTINCT OrderID),Country, CustomerName))
- Ah - if I create a measure using the FirstSortedValue() function along with my aggr() expression I can display the Max customer in that country in my table.
FirstSortedValue( value, sort_weight, rank 😞
FirstSortedValue() returns the value from the expression specified in value that corresponds to the result of sorting the sort_weight argument. So CustomerName is the value I want to display or return in the table and -aggr(Count(Distinct OrderID),Country,CustomerName) is the sort_weight argument...where " - " is used to denote the highest (or most) - the number of orders. This returns the value of the customer corresponding to the most orders for that customer.
The result - a single consolidated table showing you the customers with the most orders in their corresponding countries.
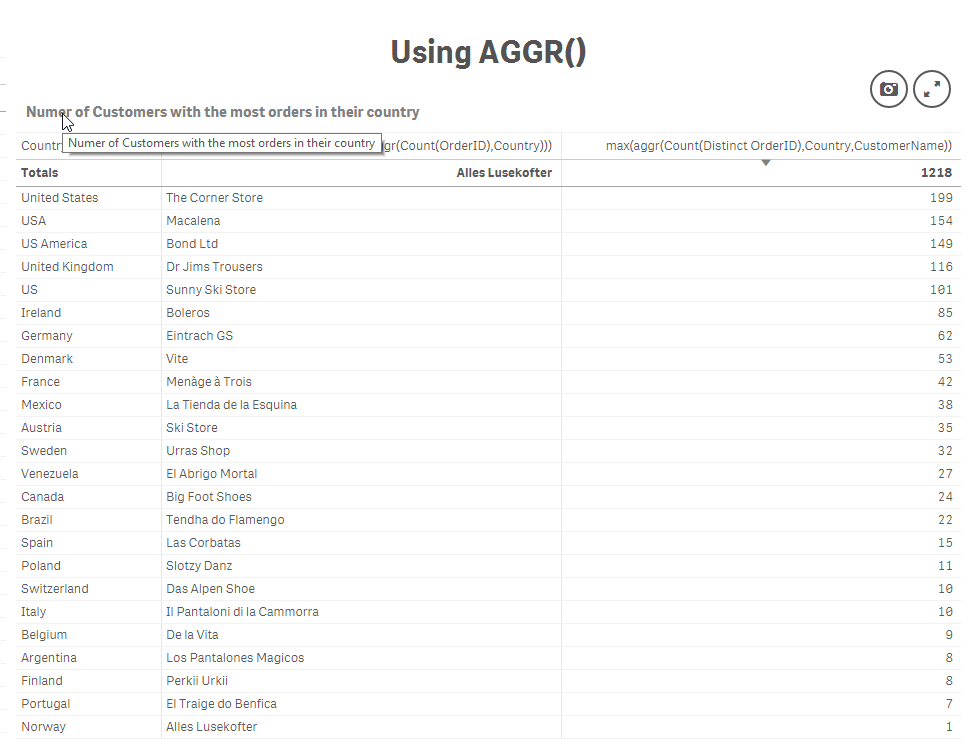
Which Customer in what Country had the most orders
Regards,
Michael Tarallo (@mtarallo) | Twitter
Qlik
Resources:
- Qlik Help
- QlikView Technical Brief - AGGR.docx
- Aggr()
- FirstSortedValue
- Sample attached (copy.qvf to your C:\Users\<user>\Documents\Qlik\Sense\Apps if you using Qlik Sense Desktop or import to Qlik Sense Enterprise using the QMC, or upload to Qlik Sense Cloud.
You must be a registered user to add a comment. If you've already registered, sign in. Otherwise, register and sign in.