- Mark as New
- Bookmark
- Subscribe
- Mute
- Subscribe to RSS Feed
- Permalink
- Report Inappropriate Content
creating visual report occupancy of warehouse area's
I am searching for a way to report the occupancy of the different area's in a warehouse. I am looking for a visual overview, so I would like to use a map of the warehouse and show the occupancy of the area in the picture (linked to a specific point in the picture). I put an example in the attachement.
Area occupancy
A 1
B 2
C 4
D 7
Now I am wondering how to solve this puzzle 
Kind regards,
Roland Huisman
- « Previous Replies
-
- 1
- 2
- Next Replies »
Accepted Solutions
- Mark as New
- Bookmark
- Subscribe
- Mute
- Subscribe to RSS Feed
- Permalink
- Report Inappropriate Content
see attached
- Mark as New
- Bookmark
- Subscribe
- Mute
- Subscribe to RSS Feed
- Permalink
- Report Inappropriate Content
You can put a picture of your warehouse as the background image of a scatter chart, use X and Y coordinates to place the circles over the correct spots (this has nothing to do with your data, it's just to get the circles into position), and use the Z (bubble size option) to size the circles according to your occupancy figures.
- Mark as New
- Bookmark
- Subscribe
- Mute
- Subscribe to RSS Feed
- Permalink
- Report Inappropriate Content
Hi Roland,
you could try something like this, its a pivot table with 2 dimensions and 1 expression, I done it for a racking system that has pick faces on the ground level and 4 upper levels
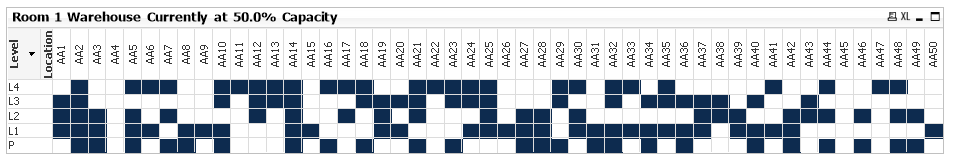
if the location is empty it's colored white, if not, it's colored dark blue
color expression is like this

hope that helps
- Mark as New
- Bookmark
- Subscribe
- Mute
- Subscribe to RSS Feed
- Permalink
- Report Inappropriate Content
Hi Roland,
you could also do what Nicole suggests, the result would be like this, the bigger the circle the more throughput through that location, I created x and y coordinates for all my locations and plotted them on a scatter chart

- Mark as New
- Bookmark
- Subscribe
- Mute
- Subscribe to RSS Feed
- Permalink
- Report Inappropriate Content
Scatter option is very time consuming depending on the number of locations you want to add, every location needs to be given an X and Y coordinate, but it will be worth it in the end
Regards
Alan
- Mark as New
- Bookmark
- Subscribe
- Mute
- Subscribe to RSS Feed
- Permalink
- Report Inappropriate Content
Hi Allan and Nicole,
I was already trying something, attached my result.
I managed to set it up, but how do you prevent the setup/total picture is ‘destroyed’ when the user is making selections of specific area’s (in my case)?
And also how can I prevent that the bubble size is changing, it is now related to the totals of the selection.
Met vriendelijke groet/with kind regards,
Roland Huisman
Technical Architect & Sr. Consultant
Tel. +31 88 3454549
Mob. +31 6 11449509
Davanti Warehousing BV
- Mark as New
- Bookmark
- Subscribe
- Mute
- Subscribe to RSS Feed
- Permalink
- Report Inappropriate Content
Have a look at the attached. Hopefully it gives you what you're looking for.
- Mark as New
- Bookmark
- Subscribe
- Mute
- Subscribe to RSS Feed
- Permalink
- Report Inappropriate Content
Hi Nicole,
We are getting there!
Is it possible to not show the bubbles of the area’s which are not in the selection?
Then it would be perfect!
Thnx for the replies!
Met vriendelijke groet/with kind regards,
Roland Huisman
Technical Architect & Sr. Consultant
Tel. +31 88 3454549
Mob. +31 6 11449509
Davanti Warehousing BV
- Mark as New
- Bookmark
- Subscribe
- Mute
- Subscribe to RSS Feed
- Permalink
- Report Inappropriate Content
If you want to only show the bubbles that are in the selection, you can take the {1} out of the bubble size calculation. However, note that this will change the size of the bubble because QV sets the size depending on the size of the other bubbles.
- Mark as New
- Bookmark
- Subscribe
- Mute
- Subscribe to RSS Feed
- Permalink
- Report Inappropriate Content
Hi Nicole,
Clear. Thank you and Alan for the replies, I can continue developing my dashboard.
Thanks again!
Met vriendelijke groet/with kind regards,
Roland Huisman
Technical Architect & Sr. Consultant
Tel. +31 88 3454549
Mob. +31 6 11449509
Davanti Warehousing BV
- « Previous Replies
-
- 1
- 2
- Next Replies »