Unlock a world of possibilities! Login now and discover the exclusive benefits awaiting you.
- Qlik Community
- :
- Forums
- :
- Analytics & AI
- :
- Products & Topics
- :
- App Development
- :
- Re: 6 Month Rolling Within 12 Month Rolling
- Subscribe to RSS Feed
- Mark Topic as New
- Mark Topic as Read
- Float this Topic for Current User
- Bookmark
- Subscribe
- Mute
- Printer Friendly Page
- Mark as New
- Bookmark
- Subscribe
- Mute
- Subscribe to RSS Feed
- Permalink
- Report Inappropriate Content
6 Month Rolling Within 12 Month Rolling
Hi there,
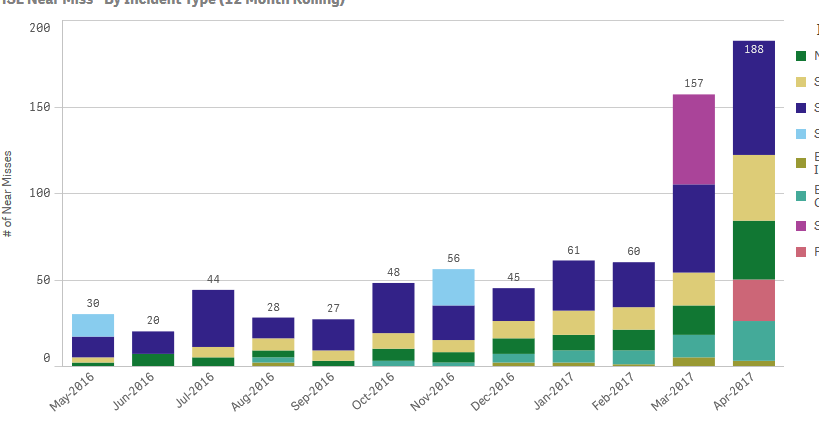
I am working on a bar chart that counts a number of issues raised and shows it for the last 12 months (starting from the previous month). So for example, this month is May 2017; this means the bar chart will show from April 2017, going back to May 2016.
Within each bar representing the months, I want to see the count of issues for the past 6 months - April 2017 should show a total of the count of issues for April, March, February, January, December, November. and then the same pattern for the other 11 months.
So far my set analysis is as follows to achieve the 12 month rolling (Static) chart:
COUNT(DISTINCT{1<NM_IncEventDate={'>=$(=MonthStart(AddMonths(Max(NM_IncEventDate),-12))) <=$(=MonthEnd(AddMonths(Max(NM_IncEventDate),-1)))'}>}NM_ID)
This only counts for each individual month, so how do I get each month within this 12 month range, to total up the last 6 months performance?
I have also attached a photo of the graph so far, below:

Thank you
- « Previous Replies
-
- 1
- 2
- Next Replies »
Accepted Solutions
- Mark as New
- Bookmark
- Subscribe
- Mute
- Subscribe to RSS Feed
- Permalink
- Report Inappropriate Content
What if you do this?
Sum({1<NM_IncEventDate = {'>=$(=MonthStart(AddMonths(Max(NM_IncEventDate),-12))) <=$(=MonthEnd(AddMonths(Max(NM_IncEventDate),-1)))'}>} Aggr(RangeSum(Above(Count({1} DISTINCT NM_ID), 0, 6)), MonthYear))
- Mark as New
- Bookmark
- Subscribe
- Mute
- Subscribe to RSS Feed
- Permalink
- Report Inappropriate Content
May be this
RangeSum(Above(
Count(DISTINCT {1<NM_IncEventDate = {'>=$(=MonthStart(AddMonths(Max(NM_IncEventDate),-12))) <=$(=MonthEnd(AddMonths(Max(NM_IncEventDate),-1)))'}>} NM_ID), 0, 6))
or you can use The As-Of Table approach
- Mark as New
- Bookmark
- Subscribe
- Mute
- Subscribe to RSS Feed
- Permalink
- Report Inappropriate Content
or maybe this:
RangeSum(Above(
Count(DISTINCT {1} NM_ID)
, 0, 6)) * Avg({1<NM_IncEventDate = {'>=$(=MonthStart(AddMonths(Max(NM_IncEventDate),-12))) <=$(=MonthEnd(AddMonths(Max(NM_IncEventDate),-1)))'}>} 1)
- Mark as New
- Bookmark
- Subscribe
- Mute
- Subscribe to RSS Feed
- Permalink
- Report Inappropriate Content
Hi Sunny,
thank you for the reply.
Your first suggestion seemed to work better than the second as it kept it to a 12 month period. However it doesn't seem to be produced the correct numbers. This is how the graph now looks with your first suggestion:
Thanks
- Mark as New
- Bookmark
- Subscribe
- Mute
- Subscribe to RSS Feed
- Permalink
- Report Inappropriate Content
I see there are two dimensions in your chart, do you mind sharing the names of your dimensions? Also, would it be possible to share a sample of your qvf file? Might be easier to look at it and test out few things?
- Mark as New
- Bookmark
- Subscribe
- Mute
- Subscribe to RSS Feed
- Permalink
- Report Inappropriate Content
Hi Sunny,
The two dimensions are MonthYear and IncidentType. MonthYear is a Time Dimension table field, much like the master calendar but one I made.
Unfortunately I cannot share the qvf as the app holds real data. Apologies for this.
- Mark as New
- Bookmark
- Subscribe
- Mute
- Subscribe to RSS Feed
- Permalink
- Report Inappropriate Content
Sunny,
An issue with trying to achieve this way having two dimensions so I had to remove one of them. I kept the date dimension.
I have a calculation that almost works now:
sum(aggr(RangeSum(above(
Count(DISTINCT {1<NM_IncEventDate = {'>=$(=MonthStart(AddMonths(Max(NM_IncEventDate),-12))) <=$(=MonthEnd(AddMonths(Max(NM_IncEventDate),-1)))'}>} NM_ID), 0, 6)),MonthYear))
However, because the range is filtered down to 12 months, it cannot reach out to previous months to get the last 6 months performance. An example of this is May 2016 cannot see Nov. 2015 - Apr. 2016 because the range is May 2016 - Apr. 2017.
- Mark as New
- Bookmark
- Subscribe
- Mute
- Subscribe to RSS Feed
- Permalink
- Report Inappropriate Content
What if you do this?
Sum({1<NM_IncEventDate = {'>=$(=MonthStart(AddMonths(Max(NM_IncEventDate),-12))) <=$(=MonthEnd(AddMonths(Max(NM_IncEventDate),-1)))'}>} Aggr(RangeSum(Above(Count({1} DISTINCT NM_ID), 0, 6)), MonthYear))
- Mark as New
- Bookmark
- Subscribe
- Mute
- Subscribe to RSS Feed
- Permalink
- Report Inappropriate Content
That's it, excellent! Works perfectly.
Thanks for the help!
- Mark as New
- Bookmark
- Subscribe
- Mute
- Subscribe to RSS Feed
- Permalink
- Report Inappropriate Content
If the above worked, this should have also worked (unless you have changed the sort)
RangeSum(Above(Count(DISTINCT {1} NM_ID), 0, 6))
*
Avg({1<NM_IncEventDate = {'>=$(=MonthStart(AddMonths(Max(NM_IncEventDate),-12))) <=$(=MonthEnd(AddMonths(Max(NM_IncEventDate),-1)))'}>} 1)
This is slightly better because this doesn't use Aggr() function... but its upto you to give it a shot 
- « Previous Replies
-
- 1
- 2
- Next Replies »