Unlock a world of possibilities! Login now and discover the exclusive benefits awaiting you.
- Qlik Community
- :
- Forums
- :
- Analytics
- :
- App Development
- :
- 6 months trend for Top 5 countries based on date s...
- Subscribe to RSS Feed
- Mark Topic as New
- Mark Topic as Read
- Float this Topic for Current User
- Bookmark
- Subscribe
- Mute
- Printer Friendly Page
- Mark as New
- Bookmark
- Subscribe
- Mute
- Subscribe to RSS Feed
- Permalink
- Report Inappropriate Content
6 months trend for Top 5 countries based on date selected
Hello Gurus,
I have a bit of complex requirement, Ill try my best to make you all understand. I have the mentioned dataset used as back-end:
| Date | Country | Value |
| 01-01-2020 | Australia | 4121 |
| 01-01-2020 | Germany | 1092 |
| 01-01-2020 | Italy | 2475 |
| 01-01-2020 | Jersey | 1548 |
| 01-01-2020 | Luxembourg | 2102 |
| 01-01-2020 | Netherlands | 1290 |
| 01-01-2020 | Singapore | 4142 |
| 01-01-2020 | Switzerland | 261528 |
| 01-01-2020 | United Kingdom | 10398 |
| 01-01-2020 | United States of America | 78009 |
| 01-02-2020 | Australia | 5024 |
| 01-02-2020 | country_unassigned | 30105 |
| 01-02-2020 | Germany | 5442 |
| 01-02-2020 | Luxembourg | 4924 |
| 01-02-2020 | Netherlands | 3677 |
| 01-02-2020 | Singapore | 3436 |
| 01-02-2020 | Switzerland | 18535 |
| 01-02-2020 | United Kingdom | 13358 |
| 01-02-2020 | United States of America | 89225 |
| 01-02-2020 | Virgin Islands (Brit) | 4277 |
| 01-04-2020 | Canada | 8823 |
| 01-04-2020 | country_unassigned | 48637 |
| 01-04-2020 | France | 11286 |
| 01-04-2020 | Germany | 11970 |
| 01-04-2020 | Japan | 7714 |
| 01-04-2020 | Luxembourg | 14027 |
| 01-04-2020 | Netherlands | 7277 |
| 01-04-2020 | Switzerland | 112202 |
| 01-04-2020 | United Kingdom | 37741 |
| 01-04-2020 | United States of America | 155936 |
| 01-05-2020 | Australia | 5388 |
| 01-05-2020 | country_unassigned | 318186 |
| 01-05-2020 | Germany | 5636 |
| 01-05-2020 | Luxembourg | 3127 |
| 01-05-2020 | Netherlands | 3327 |
| 01-05-2020 | Singapore | 3498 |
| 01-05-2020 | Switzerland | 20748 |
| 01-05-2020 | United Kingdom | 13776 |
| 01-05-2020 | United States of America | 90066 |
| 01-06-2020 | Virgin Islands (Brit) | 4046 |
| 01-06-2020 | Australia | 3458 |
| 01-06-2020 | Canada | 2739 |
| 01-06-2020 | country_unassigned | 343785 |
| 01-06-2020 | France | 2693 |
| 01-06-2020 | Germany | 5535 |
| 01-06-2020 | Luxembourg | 2450 |
| 01-06-2020 | Netherlands | 2882 |
| 01-06-2020 | Switzerland | 18619 |
| 01-06-2020 | United Kingdom | 9143 |
| 01-06-2020 | United States of America | 88556 |
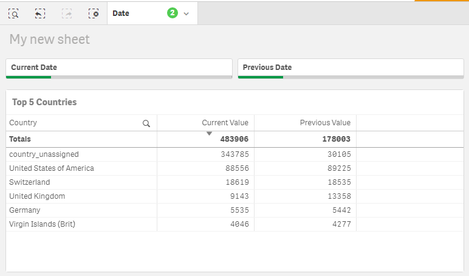
Now I have filters at top, one for Current Date and another for Previous date. All I have done is created two states, Current and Previous and applied it to each of the filter.
I have a table for Top 6 countries sorted based on the current values;
I am using mentioned expression for Current value and Previous value calculation:
Sum({[Current]}Value) and Sum({[Previous]}Value)
Now I need the 6 month trend of the same top 6 countries on line chart. The expression for dimension I used in Line chart is;
=aggr(if( rank(sum(Value))<7,Country),Country)
But the problem with this expression is the Top 5 countries are not same as those displayed in the table. I need to see Virgin Island (Brit) instead of Luxembourg in the line chart.
Can someone please help me with this ? Any help would be highly appreciated?
- Mark as New
- Bookmark
- Subscribe
- Mute
- Subscribe to RSS Feed
- Permalink
- Report Inappropriate Content
Maybe the following Design Blog post may be of some help:
https://community.qlik.com/t5/Qlik-Design-Blog/Recipe-for-a-Pareto-Analysis-Revisited/ba-p/1473684
Regards,
Brett
I now work a compressed schedule, Tuesday, Wednesday and Thursday, so those will be the days I will reply to any follow-up posts.
- Mark as New
- Bookmark
- Subscribe
- Mute
- Subscribe to RSS Feed
- Permalink
- Report Inappropriate Content
Hello,
Luxembourg is shown as a dimension because it is ranked in the overall top 6
if you want to display the same countries as in your table, you have to use the bookmarks/states Current and Previous in your calculated dimension aggr(if( rank(sum(Value))<7,Country),Country)
you want to display the TOP 6 Countries for current value AND previous value so you want to the two states/selected dates in your set analysis. I am not an expert of the set expression but i would slightly change your formula in the following way:aggr(if( rank(sum({[Current]+[Previous]}Value))<7,Country),Country) and see it if works
kind regards,
Jérôme

