Unlock a world of possibilities! Login now and discover the exclusive benefits awaiting you.
- Qlik Community
- :
- Forums
- :
- Analytics & AI
- :
- Products & Topics
- :
- App Development
- :
- Re: AGGR question
- Subscribe to RSS Feed
- Mark Topic as New
- Mark Topic as Read
- Float this Topic for Current User
- Bookmark
- Subscribe
- Mute
- Printer Friendly Page
- Mark as New
- Bookmark
- Subscribe
- Mute
- Subscribe to RSS Feed
- Permalink
- Report Inappropriate Content
AGGR question
Hello all,
I have this table in my data model:
| EmployeeID | DateID | T_minutes | A_Minutes | A_Code | Year | Month |
| 03 | 01/01/2022 | 100 | - | - | 01 | 2022 |
| 03 | 02/01/2022 | 100 | - | - | 01 | 2022 |
| 03 | 02/01/2022 | - | 20 | A1 | 01 | 2022 |
| 03 | 02/01/2022 | - | 50 | A2 | 01 | 2022 |
| 04 | 01/01/2022 | 100 | - | - | 01 | 2022 |
| 04 | 02/01/2022 | 100 | - | - | 01 | 2022 |
I would need to summarize the T_minutes and A_minutes per Year, Month and A_Code.
Something like this pivot table:
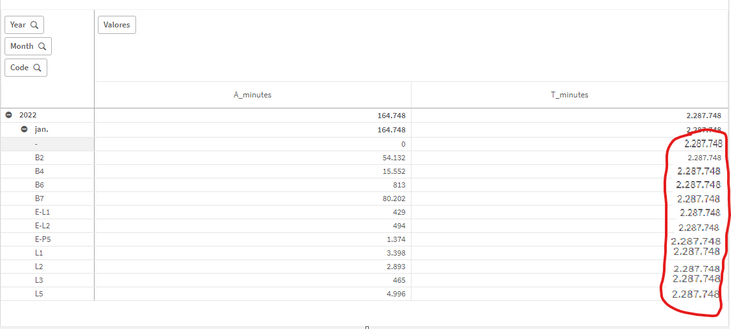
As you can see, the T_minutes column has no values for some of the A_codes. It works fine if I collapse the columns.
Formulas are:
- A_minutes =Sum ([A_minutes])
- T_minutes = sum(aggr(Sum ([T_minutes]), Year, Month))
I would like to reflect the total T_minutes per Year and Month in the second column, but I cannot find the correct formula to do this. As you can see, some values are null.
Can this be achieved using AGGR with the above data model?
Many thanks in advance.
Accepted Solutions
- Mark as New
- Bookmark
- Subscribe
- Mute
- Subscribe to RSS Feed
- Permalink
- Report Inappropriate Content
Hi, understood.
Usually aggr() is used to make additonal group to the existing dimensions, when used in the opposite way, like this when all the parameters of aggr(year and month) exists as dimension and there is an additional dimension, it only shows by default the value on one of the rows.
To do this it will be better to use the TOTAl qualifier wich is used to ignore dimension, in this case this expression can be used: Sum(TOTAL <Year, Month> [T_minutes]).
- Mark as New
- Bookmark
- Subscribe
- Mute
- Subscribe to RSS Feed
- Permalink
- Report Inappropriate Content
Hi, I can't full understand what are you trying to achieve, can you post an example of the result you want?
- Mark as New
- Bookmark
- Subscribe
- Mute
- Subscribe to RSS Feed
- Permalink
- Report Inappropriate Content
Hello Rubén,
many thanks for your answer.
This is what I get now if the chart is unexpanded: total A_minutes and T_minutes per Year and Month. Correct.
But when the Month is expanded and the Code is shown, this is what I get:
I would like the T_minutes column to show the total T_Minutes (2.287.748) for that Year-Month in every row, and not zeroes or the whole value in B2 (or any other code).
This is what we need:
Please let me know if my question is clear.
Many thanks in advance.
- Mark as New
- Bookmark
- Subscribe
- Mute
- Subscribe to RSS Feed
- Permalink
- Report Inappropriate Content
Hi, understood.
Usually aggr() is used to make additonal group to the existing dimensions, when used in the opposite way, like this when all the parameters of aggr(year and month) exists as dimension and there is an additional dimension, it only shows by default the value on one of the rows.
To do this it will be better to use the TOTAl qualifier wich is used to ignore dimension, in this case this expression can be used: Sum(TOTAL <Year, Month> [T_minutes]).
- Mark as New
- Bookmark
- Subscribe
- Mute
- Subscribe to RSS Feed
- Permalink
- Report Inappropriate Content
Hello Rubén,
thanks a lot, this worked like a charm.


