Unlock a world of possibilities! Login now and discover the exclusive benefits awaiting you.
- Qlik Community
- :
- Forums
- :
- Analytics & AI
- :
- Products & Topics
- :
- App Development
- :
- Re: Accumulating works with one line, but figures ...
- Subscribe to RSS Feed
- Mark Topic as New
- Mark Topic as Read
- Float this Topic for Current User
- Bookmark
- Subscribe
- Mute
- Printer Friendly Page
- Mark as New
- Bookmark
- Subscribe
- Mute
- Subscribe to RSS Feed
- Permalink
- Report Inappropriate Content
Accumulating works with one line, but figures seem to double when I chose another value
Hi,
I am building a line chart where I am trying to compare the amount / # of payments at x amounts of days from the first payment date on a campaign.
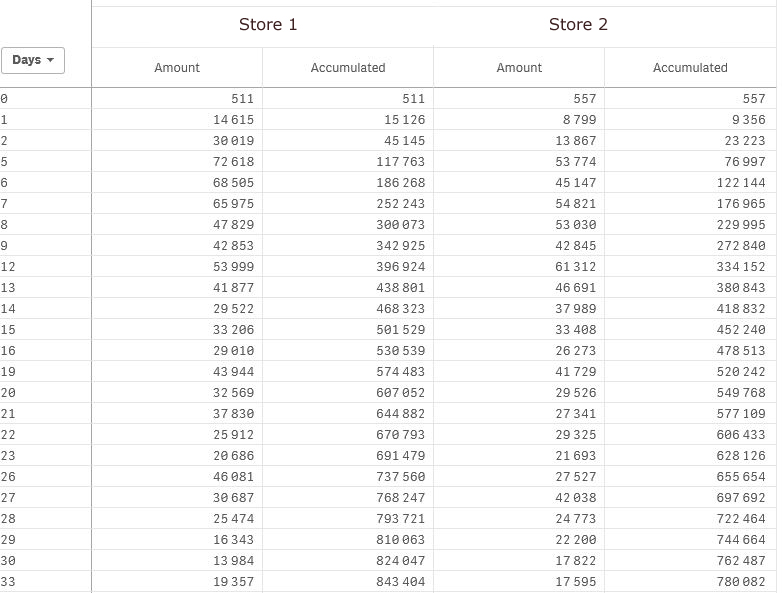
The pivot table looks like this (which is correct) (there is two different stores here, blurred the names but pretend it is Store #1 on left and Store #2 on right in the pivot table):
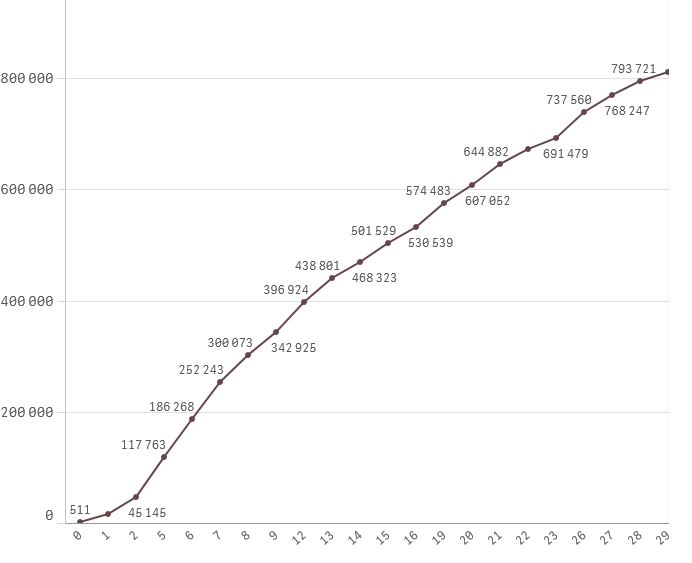
And when I chose Store #1 it accumulates correctly on the line:
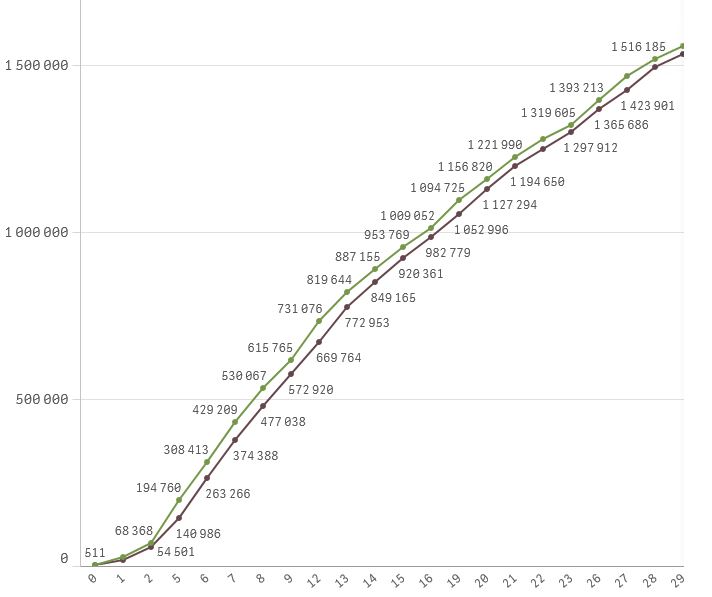
The issue is when I add Store #2 where I also want the line to accumulate the number's don't add up. It is almost as if they double or add up and because of the measure.
The Dimensions are:
1: DATE([Payment Date]) - DATE([First Payment Date) - Gives me amount of days since first payment day which I want the X axis to be.
2: Stores - Gives me different lines
Measure:
RangeSum(Above(Total Sum([Sales] * 1),0,99)) - Used to give me accumulating lines.
What I am suspecting is when I chose two stores the Total part makes it double or add them both and then do some sort of calculation from that when accumulating.
Thougths?
Accepted Solutions
- Mark as New
- Bookmark
- Subscribe
- Mute
- Subscribe to RSS Feed
- Permalink
- Report Inappropriate Content
Ali Ahmad wrote:
So lets say I do that and named it "DaysBetween"
= aggr (
RangeSum(Above(Total Sum([Sales] * 1),0,99)), Store, DaysBetween)
I think you should remove the TOTAL qualifier, to reset the accumulation at the column segment boundery:
=Aggr( Rangesum(Above(Sum(Sales),0,RowNo() )), Store, (DaysBetween, (NUMERIC, ASCENDING)) )
- Mark as New
- Bookmark
- Subscribe
- Mute
- Subscribe to RSS Feed
- Permalink
- Report Inappropriate Content
I think that's because your line chart with two dimensions translate to a straight table chart with the two dimensions ordered by you date difference, Stores, so for each date difference, the stores are listed, while you want to have a table which is ordered by Store , then date difference.
You can change this order e.g. using advanced aggregation, but the aggr() function does not allow calculated dimensions.
Can you calculate the date difference already in the script?
- Mark as New
- Bookmark
- Subscribe
- Mute
- Subscribe to RSS Feed
- Permalink
- Report Inappropriate Content
And if you can workaround the calculated dimension, maybe another option would be an AsOf table approach:
- Mark as New
- Bookmark
- Subscribe
- Mute
- Subscribe to RSS Feed
- Permalink
- Report Inappropriate Content
So lets say I do that and named it "DaysBetween"
= aggr (
RangeSum(Above(Total Sum([Sales] * 1),0,99)), Store, DaysBetween)
- Mark as New
- Bookmark
- Subscribe
- Mute
- Subscribe to RSS Feed
- Permalink
- Report Inappropriate Content
I've read about this and didn't really give it a go to be honest, but I am going to try!
- Mark as New
- Bookmark
- Subscribe
- Mute
- Subscribe to RSS Feed
- Permalink
- Report Inappropriate Content
Ali Ahmad wrote:
So lets say I do that and named it "DaysBetween"
= aggr (
RangeSum(Above(Total Sum([Sales] * 1),0,99)), Store, DaysBetween)
I think you should remove the TOTAL qualifier, to reset the accumulation at the column segment boundery:
=Aggr( Rangesum(Above(Sum(Sales),0,RowNo() )), Store, (DaysBetween, (NUMERIC, ASCENDING)) )
- Mark as New
- Bookmark
- Subscribe
- Mute
- Subscribe to RSS Feed
- Permalink
- Report Inappropriate Content
Worked when I put DaysBetween in the script and then used Aggr().
Thank you so much for the help. Really great stuff!