Unlock a world of possibilities! Login now and discover the exclusive benefits awaiting you.
- Qlik Community
- :
- Forums
- :
- Analytics & AI
- :
- Products & Topics
- :
- App Development
- :
- Add reference line in scatter plot chart (Qliksens...
- Subscribe to RSS Feed
- Mark Topic as New
- Mark Topic as Read
- Float this Topic for Current User
- Bookmark
- Subscribe
- Mute
- Printer Friendly Page
- Mark as New
- Bookmark
- Subscribe
- Mute
- Subscribe to RSS Feed
- Permalink
- Report Inappropriate Content
Add reference line in scatter plot chart (Qliksense)
Hello,
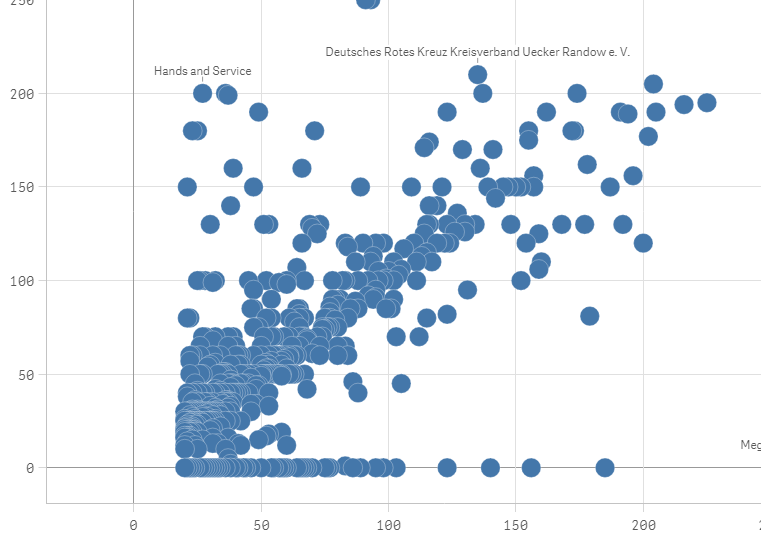
I am trying to add a simple y=x axis (diagonal) to my scatter plot chart but I haven'd found any method until now.
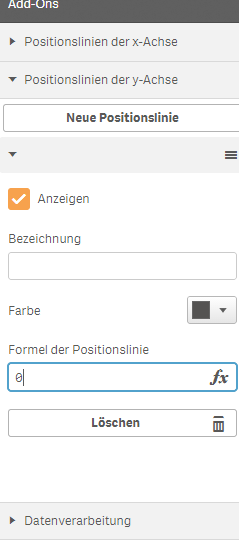
There is a possibility to add a Position line in the Add-on section, but I only managed to display a vertical or horizontal line, and not a diagonal as I would want to. How would it be possible?
Thanks in advance
- Mark as New
- Bookmark
- Subscribe
- Mute
- Subscribe to RSS Feed
- Permalink
- Report Inappropriate Content
Christophe
I'm seeking the same feature/function.
I've come across this thread - Possible to add a trend line to a scatter plot in QlikSense?
which leads to another thread and a possible workbook with a formula that I'm trying to get my head around now.
Bottomline - it seems possible, but as QV has been doing this for years (above link takes you to a 2014 thread) but the 'self service' application doesn't.
Adding a reply just so you know others are interested as well.
Jon