Unlock a world of possibilities! Login now and discover the exclusive benefits awaiting you.
- Qlik Community
- :
- Forums
- :
- Analytics & AI
- :
- Products & Topics
- :
- App Development
- :
- Re: Adding a calculated row to a pivot table
- Subscribe to RSS Feed
- Mark Topic as New
- Mark Topic as Read
- Float this Topic for Current User
- Bookmark
- Subscribe
- Mute
- Printer Friendly Page
- Mark as New
- Bookmark
- Subscribe
- Mute
- Subscribe to RSS Feed
- Permalink
- Report Inappropriate Content
Adding a calculated row to a pivot table
Hi,
I have a requirement to add a calculated row into the pivot table. In my table I'm representing annual turnover of five different companies along with the annual budget. Columns represents the companies.Rows represents the annual turnover and annual budget.
My requirement is to show each individual achievement percentage on the bottom row by dividing budget/ turnover *100
Any possibility to do this
- Mark as New
- Bookmark
- Subscribe
- Mute
- Subscribe to RSS Feed
- Permalink
- Report Inappropriate Content
Can you provide current situation and required solution in any image, for example?
- Mark as New
- Bookmark
- Subscribe
- Mute
- Subscribe to RSS Feed
- Permalink
- Report Inappropriate Content
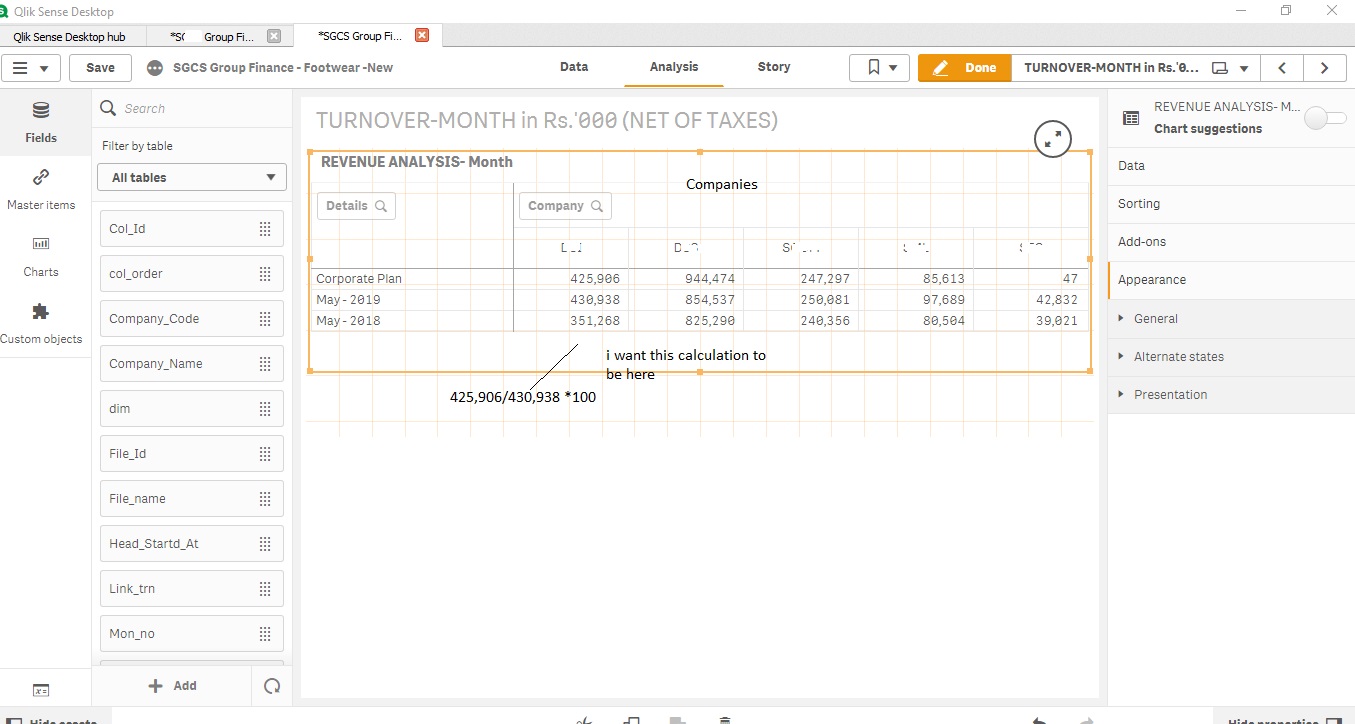
I have attached a screenshot for your reference.
My requirement is to add a calculated row as the bottom row for the pivot table
values in the first row "corporate plan" must be divided by the values of the second row "May-2019" and multiply that by 100 to get the percentage value.
Each field must represent the corresponding percentage value on the bottom field of each column
Hope you can get the idea
- Mark as New
- Bookmark
- Subscribe
- Mute
- Subscribe to RSS Feed
- Permalink
- Report Inappropriate Content
If its acceptable, you can add custom first line by enabling Totals for Details dimension like:

And expression like: IF(Dimensionality()=0, 'budget/ turnover *100', Sum(Value)).
Just replace 'budget/ turnover *100' string by another formula.
- Mark as New
- Bookmark
- Subscribe
- Mute
- Subscribe to RSS Feed
- Permalink
- Report Inappropriate Content
Hi Simon,
Any possibility to do this with new P&L Pivot table