Unlock a world of possibilities! Login now and discover the exclusive benefits awaiting you.
Announcements
Qlik and ServiceNow Partner to Bring Trusted Enterprise Context into AI-Powered Workflows. Learn More!
- Qlik Community
- :
- Forums
- :
- Analytics & AI
- :
- Products & Topics
- :
- App Development
- :
- Re: Adding string literal to a measure on line cha...
Options
- Subscribe to RSS Feed
- Mark Topic as New
- Mark Topic as Read
- Float this Topic for Current User
- Bookmark
- Subscribe
- Mute
- Printer Friendly Page
Turn on suggestions
Auto-suggest helps you quickly narrow down your search results by suggesting possible matches as you type.
Showing results for
Anonymous
Not applicable
2017-10-31
02:37 PM
- Mark as New
- Bookmark
- Subscribe
- Mute
- Subscribe to RSS Feed
- Permalink
- Report Inappropriate Content
Adding string literal to a measure on line chart
Hi,
I have a line chart that looks like this.
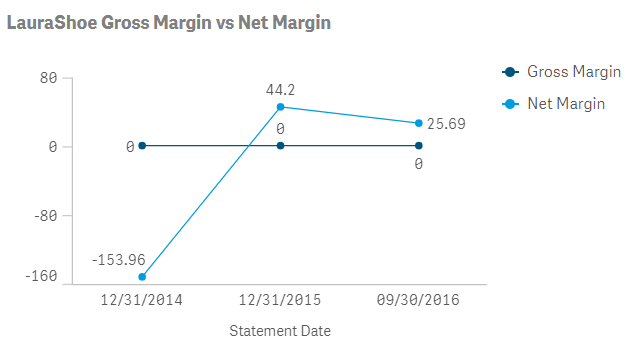
I want to append the string literal '%' to all the values on the line chart. Ex: -153.96 must become -153.96%. 44.2 must become 44.2%.
The values are coming from a measure as seen below
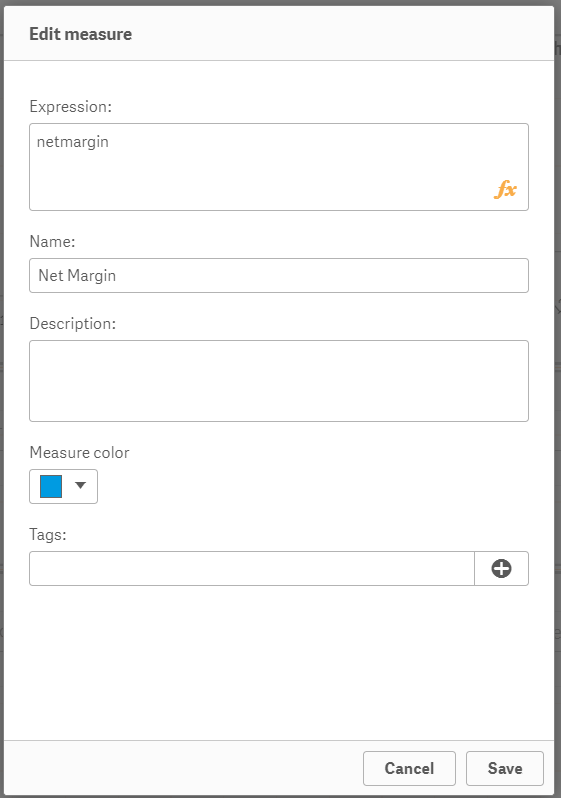
How can I make this happen?
Thanks!
2,078 Views
1 Solution
Accepted Solutions
Anonymous
Not applicable
2017-10-31
03:39 PM
Author
- Mark as New
- Bookmark
- Subscribe
- Mute
- Subscribe to RSS Feed
- Permalink
- Report Inappropriate Content
2,024 Views
4 Replies
Specialist II
2017-10-31
03:33 PM
- Mark as New
- Bookmark
- Subscribe
- Mute
- Subscribe to RSS Feed
- Permalink
- Report Inappropriate Content
Hi,
Have you tried following
Number formatting and selecting %

2,024 Views
Anonymous
Not applicable
2017-10-31
03:39 PM
Author
- Mark as New
- Bookmark
- Subscribe
- Mute
- Subscribe to RSS Feed
- Permalink
- Report Inappropriate Content
I figured it out.
2,025 Views
Specialist
2017-10-31
03:41 PM
- Mark as New
- Bookmark
- Subscribe
- Mute
- Subscribe to RSS Feed
- Permalink
- Report Inappropriate Content
you can use either custom formatting by simply adding '%' at the end or
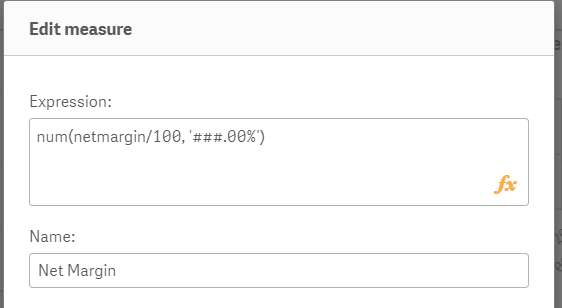
change the exp to num(netmargin/100,'##.#0%')
2,024 Views
Anonymous
Not applicable
2017-10-31
03:42 PM
Author
- Mark as New
- Bookmark
- Subscribe
- Mute
- Subscribe to RSS Feed
- Permalink
- Report Inappropriate Content
This does not work. When I do this, the value is getting displayed as 15396.00% instead of 153.96%.
2,024 Views