Unlock a world of possibilities! Login now and discover the exclusive benefits awaiting you.
- Qlik Community
- :
- Forums
- :
- Analytics & AI
- :
- Products & Topics
- :
- App Development
- :
- Ageing Buckets !!
- Subscribe to RSS Feed
- Mark Topic as New
- Mark Topic as Read
- Float this Topic for Current User
- Bookmark
- Subscribe
- Mute
- Printer Friendly Page
- Mark as New
- Bookmark
- Subscribe
- Mute
- Subscribe to RSS Feed
- Permalink
- Report Inappropriate Content
Ageing Buckets !!
Hello Qlik Experts,
I have the following table (Sample Data) :
| Code | Account Number | Quantity | Stock | Date | Type | Value |
|---|---|---|---|---|---|---|
| A01 | 00126 | 6000 | 5500 | 05/15/2018 | 100 | 11000 |
| A01 | 00126 | 3000 | 5500 | 04/21/2018 | 100 | 11000 |
| A01 | 00126 | 1500 | 5500 | 02/03/2017 | 100 | 11000 |
| A11 | 00243 | 7000 | 8200 | 03/03/2018 | 100 | 4100 |
| A11 | 00243 | 3000 | 8200 | 03/01/2018 | 100 | 4100 |
| A11 | 00245 | 1000 | 8200 | 12/23/2014 | 100 | 4100 |
| A11 | 00243 | 5000 | 8200 | 02/23/2014 | 100 | 4100 |
| A11 | 00243 | 4000 | 8200 | 02/02/2014 | 100 | 4100 |
| A55 | 00455 | 9000 | 15000 | 11/13/2017 | 100 | 5000 |
| A55 | 00455 | 17000 | 15000 | 1/13/2017 | 100 | 5000 |
| B10 | 01666 | 3000 | 1500 | 05/23/2018 | 100 | 9000 |
| B10 | 01666 | 2000 | 1500 | 03/03/2018 | 100 | 9000 |
| B10 | 01700 | 1500 | 1500 | 01/23/2017 | 100 | 9000 |
| B10 | 01700 | 7000 | 1500 | 01/03/2017 | 100 | 9000 |
| C41 | 00300 | 1000 | 350 | 02/14/2016 | 100 | 3500 |
| C41 | 00300 | 40 | 350 | 01/05/2016 | 100 | 3500 |
| C41 | 00300 | 100 | 350 | 12/22/2015 | 100 | 3500 |
| E03 | 00026 | 6000 | 5000 | 03/01/2018 | 100 | 7500 |
| F22 | 05622 | 100 | 750 | 12/17/2017 | 100 | 1500 |
| F22 | 05625 | 800 | 750 | 12/17/2016 | 100 | 1500 |
| H20 | 00666 | 25000 | 10000 | 05/15/2018 | 100 | 250 |
| H20 | 00666 | 3000 | 10000 | 04/15/2018 | 100 | 250 |
| H20 | 00666 | 17000 | 10000 | 03/15/2018 | 100 | 250 |
| H20 | 00666 | 55000 | 10000 | 02/15/2018 | 100 | 250 |
| H20 | 00666 | 2300 | 10000 | 01/15/2018 | 100 | 250 |
| H20 | 00666 | 1500 | 10000 | 1/13/2018 | 100 | 250 |
| K15 | 12268 | 300 | 2500 | 05/07/2018 | 100 | 2500 |
| K15 | 12268 | 1300 | 2500 | 04/22/2018 | 100 | 2500 |
| K15 | 12268 | 500 | 2500 | 03/25/2018 | 100 | 2500 |
| K15 | 12268 | 1000 | 2500 | 12/7/2017 | 100 | 2500 |
| L01 | 14760 | 500 | 2000 | 05/04/2018 | 100 | 2200 |
| L01 | 14760 | 250 | 2000 | 05/02/2018 | 100 | 2200 |
| L01 | 14760 | 450 | 2000 | 04/04/2018 | 100 | 2200 |
| L01 | 14760 | 300 | 2000 | 02/14/2018 | 100 | 2200 |
| L01 | 14760 | 1000 | 2000 | 02/10/2018 | 100 | 2200 |
These are values of multiple Tables combined into a single table (Stock Value is Multiplied on account of Joining of 2 Tables).
The 'Value Field' and 'Stock Field' are related to each other
I have to calculate Ageing as per the following (Today = 05/31/2018, 'MM/DD/YY') :
- First I have to compare the Stock and Quantity with respect to Date [From Max(Date) to Min(Date)].
- If for a Particular Code starting from its 1st value, Quantity is greater than Stock, the Stock should appear in a Day Bucket that is equal to [Today() - Date] (Check Code A01, B10, C41, E03, H20).
- If for a Particular Code starting from its 1st value, Stock is greater than Quantity, there will be more than 1 Bucket. Move on to the Next Date and Quantity of the same Code check the sum of the 2 Quantities now. Now if the Sum of the 2 Quantities are greater than the Stock, then the Values will be split in 2 Buckets are per the Date Difference.
- First Bucket will have Quantity (First quantity value).
- Second Bucket will Have Stock - (1st Quantity) [Check Code A11, A55, F22].
- Suppose even after 2 Quantity Values, the Stock is still greater (Check Code K15), then move on to the 3rd value of Quantity and then compare with the stock value. Now there will be more then 2 Buckets:
- 1st Bucket will have the 1st Quantity,
- 2nd Bucket will have the 2nd Quantity.
- 3rd Bucket will have the 3rd Quantity.
- 4th Bucket will Have Stock - (1st Quantity + 2nd Quantity + 3rd Quantity)
- If still the Quantity is less than stock, the same trend continues (Check Code L01).
The Date Field has to be sorted in Descending order w.r.t. Code
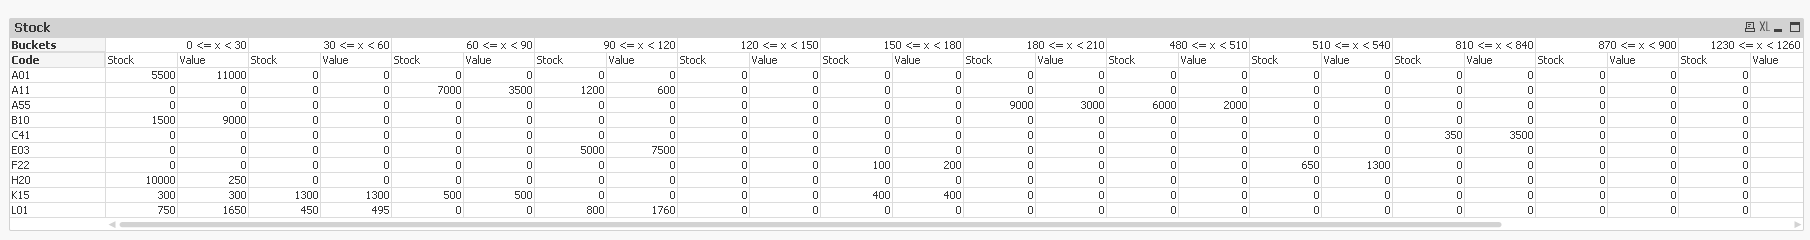
So My Output should be the following:
| Code | Account Number | Stock | Type | Value | 0-30 Days Stock | 31-60 Days Stock | 61-90 Days Stock | 91-120 Days Stock | 121-150 Days Stock | 151-180 Days Stock | 181-270 Days Stock | 271-365 Days Stock | 366-730 Days Stock | 730+ Days Stock | 0-30 Days Value | 31-60 Days value | 61-90 Days Value | 91-120 Days Value | 121-150 Days Value | 151-180 Days Value | 181-270 Days Value | 271-365 Days Value | 366-730 Days Value | 730+ Days Value |
|---|---|---|---|---|---|---|---|---|---|---|---|---|---|---|---|---|---|---|---|---|---|---|---|---|
| A01 | 00126 | 5500 | 100 | 11000 | 5500 | 0 | 0 | 0 | 0 | 0 | 0 | 0 | 0 | 0 | 11000 | 0 | 0 | 0 | 0 | 0 | 0 | 0 | 0 | 0 |
| A11 | 00243 | 8200 | 100 | 4100 | 0 | 7000 | 0 | 1200 | 0 | 0 | 0 | 0 | 0 | 0 | 0 | 3500 | 0 | 600 | 0 | 0 | 0 | 0 | 0 | 0 |
| A55 | 00455 | 15000 | 100 | 5000 | 0 | 0 | 0 | 0 | 0 | 0 | 9000 | 0 | 6000 | 0 | 0 | 0 | 0 | 0 | 0 | 0 | 3000 | 0 | 2000 | 0 |
| B10 | 01666 | 1500 | 100 | 9000 | 1500 | 0 | 0 | 0 | 0 | 0 | 0 | 0 | 0 | 0 | 9000 | 0 | 0 | 0 | 0 | 0 | 0 | 0 | 0 | 0 |
| C41 | 00300 | 350 | 100 | 3500 | 0 | 0 | 0 | 0 | 0 | 0 | 0 | 0 | 0 | 350 | 0 | 0 | 0 | 0 | 0 | 0 | 0 | 0 | 0 | 3500 |
| E03 | 00026 | 5000 | 100 | 7500 | 0 | 0 | 0 | 0 | 5000 | 0 | 0 | 0 | 0 | 0 | 0 | 0 | 0 | 0 | 7500 | 0 | 0 | 0 | 0 | 0 |
| F22 | 05622 | 750 | 100 | 1500 | 0 | 0 | 0 | 0 | 0 | 100 | 0 | 0 | 650 | 0 | 0 | 0 | 0 | 0 | 0 | 200 | 0 | 0 | 1300 | 0 |
| H20 | 00666 | 10000 | 100 | 250 | 10000 | 0 | 0 | 0 | 0 | 0 | 0 | 0 | 0 | 0 | 250 | 0 | 0 | 0 | 0 | 0 | 0 | 0 | 0 | 0 |
| K15 | 12268 | 2500 | 100 | 2500 | 300 | 1300 | 500 | 0 | 0 | 400 | 0 | 0 | 0 | 0 | 300 | 1300 | 500 | 0 | 0 | 400 | 0 | 0 | 0 | 0 |
| L01 | 14760 | 2000 | 100 | 2200 | 750 | 450 | 0 | 800 | 0 | 0 | 0 | 0 | 0 | 0 | 825 | 495 | 0 | 880 | 0 | 0 | 0 | 0 | 0 | 0 |
I am attaching this on an Excel Sheet as well (Input and Output) for further Reference.
Thanks In Advance.
- « Previous Replies
-
- 1
- 2
- Next Replies »
Accepted Solutions
- Mark as New
- Bookmark
- Subscribe
- Mute
- Subscribe to RSS Feed
- Permalink
- Report Inappropriate Content
Attaching the updated app
- Mark as New
- Bookmark
- Subscribe
- Mute
- Subscribe to RSS Feed
- Permalink
- Report Inappropriate Content
Something like this?
- Mark as New
- Bookmark
- Subscribe
- Mute
- Subscribe to RSS Feed
- Permalink
- Report Inappropriate Content
Hi Sunny,
Thanks for your reply and taking out the time to help.
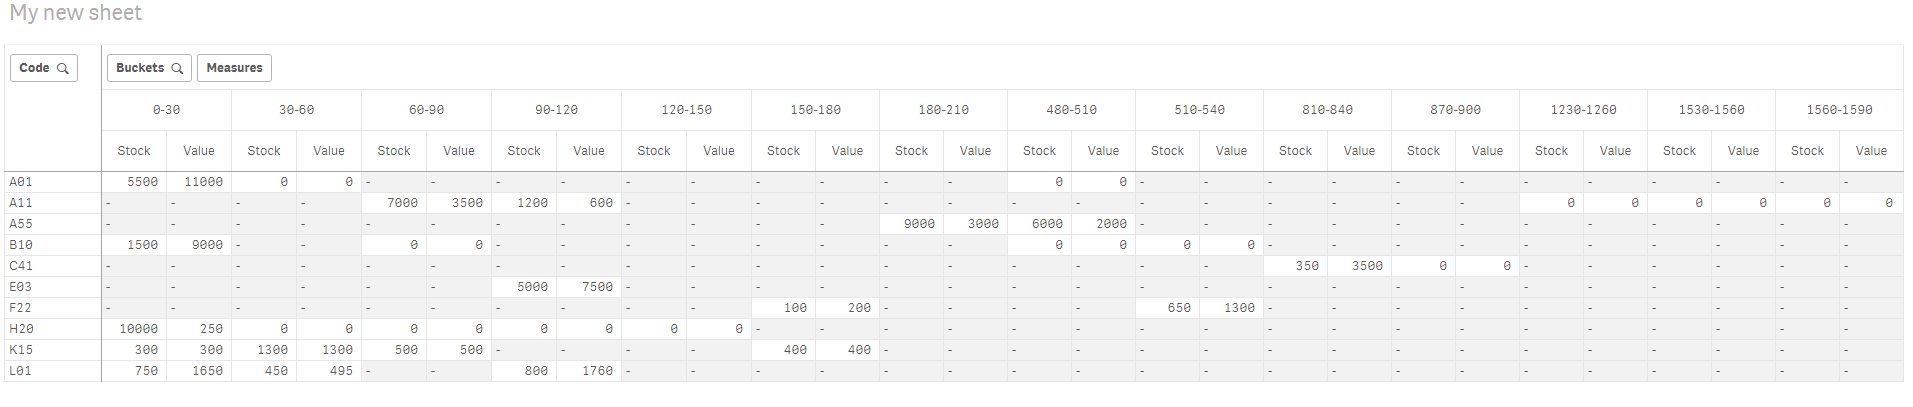
However I want the Buckets (0-30, 31-60 and so on ... ) As Dimensions.
And the Stock Field & Value Field are related to each other.
So when the Stock splits in Buckets, the Value Field should also split accordingly in Buckets.
Just another request, if you can provide a .qvf file format since i use Qlik Sense then it would be of great help.
Thanks once again.
- Mark as New
- Bookmark
- Subscribe
- Mute
- Subscribe to RSS Feed
- Permalink
- Report Inappropriate Content
Looks better?
- Mark as New
- Bookmark
- Subscribe
- Mute
- Subscribe to RSS Feed
- Permalink
- Report Inappropriate Content
Thanks again.
So if I Use a Cross Table will that work to get the Values In Buckets Field in Dimensions.
And if I change the Buckets statement to Suit my Bucket needs will that work as well ??
- Mark as New
- Bookmark
- Subscribe
- Mute
- Subscribe to RSS Feed
- Permalink
- Report Inappropriate Content
Here is for the exact same format
You can change the bucket accordingly by changing this
Replace(Class(Today() - Date, 30), ' <= x < ', '-') as Buckets
- Mark as New
- Bookmark
- Subscribe
- Mute
- Subscribe to RSS Feed
- Permalink
- Report Inappropriate Content
This is exactly what i wanted
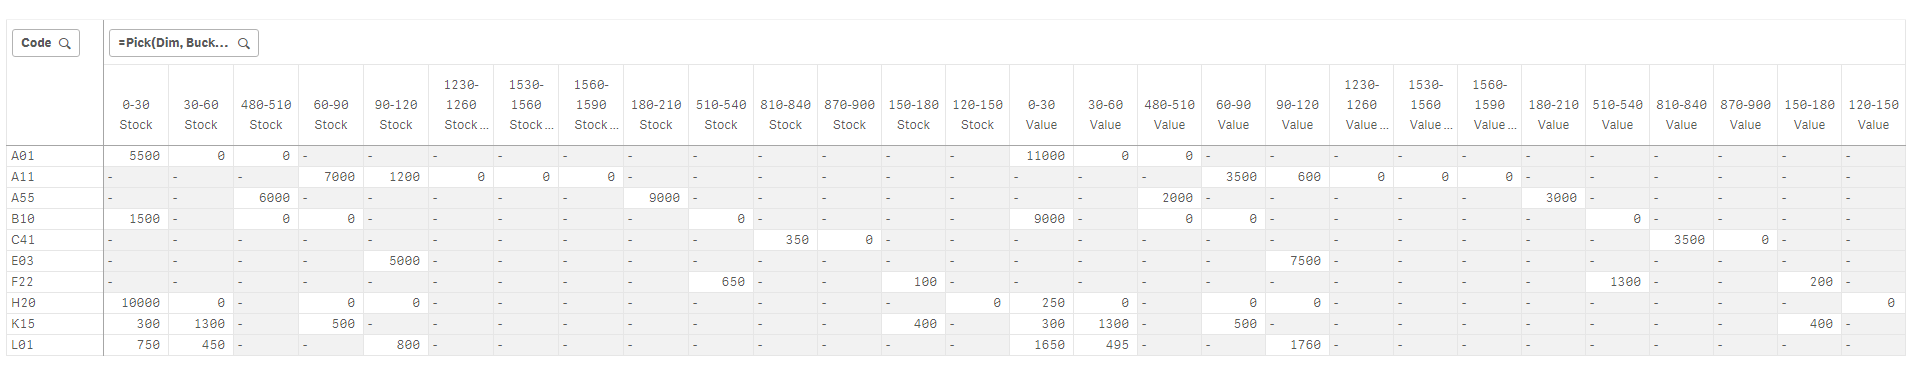
However is it possible to show this in a straight Table
- Mark as New
- Bookmark
- Subscribe
- Mute
- Subscribe to RSS Feed
- Permalink
- Report Inappropriate Content
Sure, you will just need to create 15-20 expression... one each for each of your bucket 
- Mark as New
- Bookmark
- Subscribe
- Mute
- Subscribe to RSS Feed
- Permalink
- Report Inappropriate Content
Table:
LOAD
Code,
"Account Number",
Quantity,
Stock,
"Date",
"Type",
Value
FROM [lib://Hello/Sheet For Buckets.xlsx]
(ooxml, embedded labels, table is Input);
FinalTable:
LOAD *,
If(Code = Previous(Code),
If(Peek('Temp1') < 0, If(Temp1 > 0, Stock - Peek('CumQuantity'), Quantity), 0), If(Temp1 > 0, Stock, Quantity)) as Temp2;
LOAD *,
If(Code = Previous(Code), RangeSum(Peek('CumQuantity'), Quantity), Quantity) as CumQuantity,
If(Code = Previous(Code), RangeSum(Peek('CumQuantity'), Quantity), Quantity) - Stock as Temp1,
// Replace(Class(Today() - Date, 30), ' <= x < ', '-') as Buckets
if(Today() - "Date" <= 30, Stock,'0') as [0-30 Days],
if(Today() - "Date" > 30 and Today() - "Date" <= 60, Stock,'0') as [31-60 Days],
if(Today() - "Date" > 60 and Today() - "Date" <= 90, Stock,'0') as [61-90 Days],
if(Today() - "Date" > 90 and Today() - "Date" <= 120, Stock,'0') as [91-120 Days],
if(Today() - "Date" > 120 and Today() - "Date" <= 180, Stock,'0') as [121-180 Days],
if(Today() - "Date" > 180 and Today() - "Date" <= 270, Stock,'0') as [181-270 Days],
if(Today() - "Date" > 270 and Today() - "Date" <= 365, Stock,'0') as [271-365 Days],
if(Today() - "Date" > 365, Stock,'0') as [>365 Days]
Resident Table
Order By Code, Date desc;
DROP Table Table;
Dim:
LOAD * INLINE [
Dim
1
2
];
I tried this code, However it was not splitting the stock as per Buckets.
- Mark as New
- Bookmark
- Subscribe
- Mute
- Subscribe to RSS Feed
- Permalink
- Report Inappropriate Content
Attach back the qvf please
- « Previous Replies
-
- 1
- 2
- Next Replies »