Unlock a world of possibilities! Login now and discover the exclusive benefits awaiting you.
- Qlik Community
- :
- Forums
- :
- Analytics & AI
- :
- Products & Topics
- :
- App Development
- :
- Re: Any example to create drill down table?
- Subscribe to RSS Feed
- Mark Topic as New
- Mark Topic as Read
- Float this Topic for Current User
- Bookmark
- Subscribe
- Mute
- Printer Friendly Page
- Mark as New
- Bookmark
- Subscribe
- Mute
- Subscribe to RSS Feed
- Permalink
- Report Inappropriate Content
Any example to create drill down table?
Hi Team,
I need to create a table chart with drill down feature. In this table, I will have two columns only, which are Product-SubProduct and Count(distinct total(customer)).
So basically the Count(distinct total(customer)) should change when I drill down through the dimension level.
At product level, Count(distinct total(customer)) will count total customers for each product.
When drill down to sub product level, this will count total customers for each sub product.
Or any idea to get this work?
Very appreciate
Kind Regards
Lisa
- Mark as New
- Bookmark
- Subscribe
- Mute
- Subscribe to RSS Feed
- Permalink
- Report Inappropriate Content
Hi Lisa
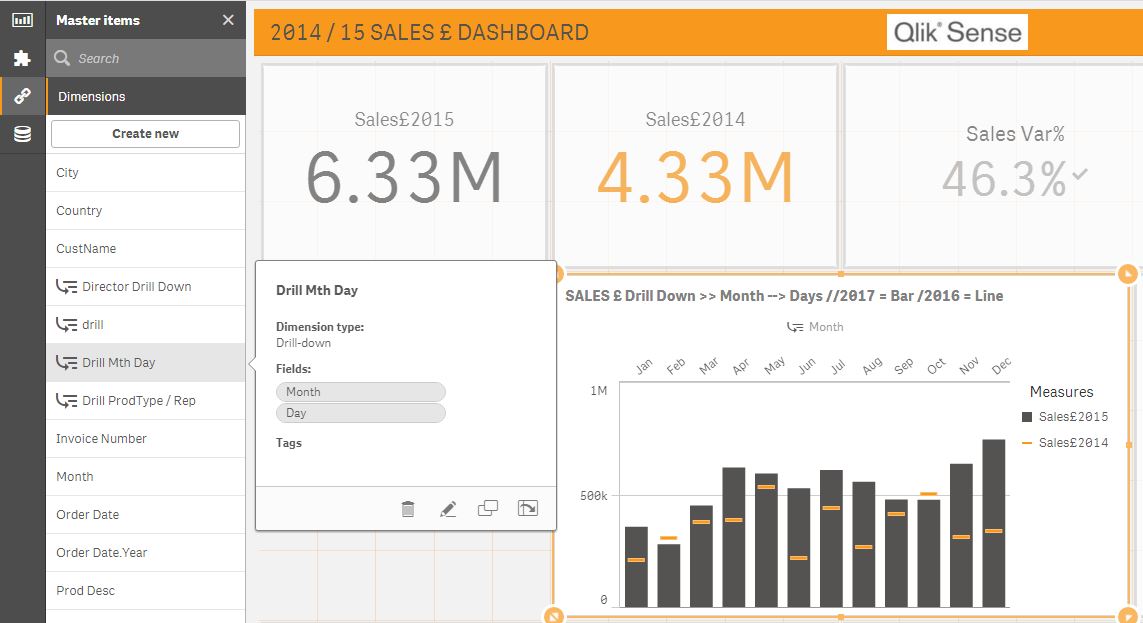
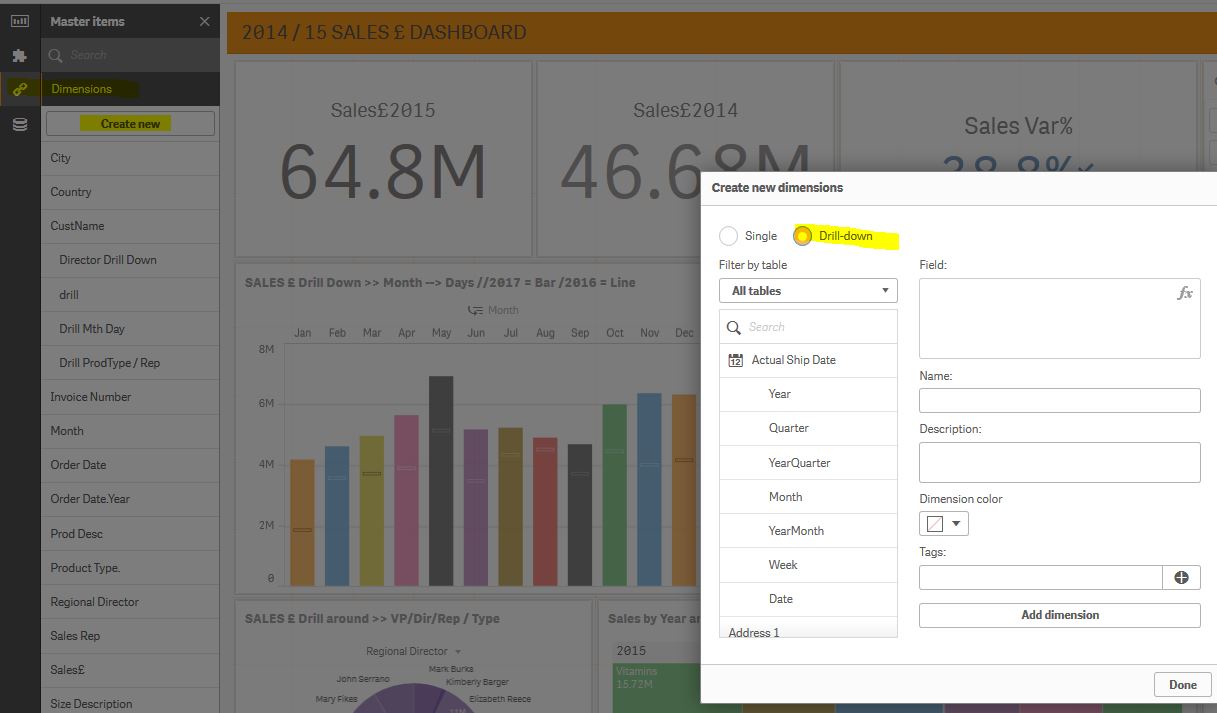
The first step is to step up a drill down dimension. Say product and sub-product called say 'Product Drill Down'
Then you use this 'Product Drill Down' dimension in the chart
So when you click (filter by) on one product and one product only the chart will automatically drill down to the sub product level for that chart
To set up the Drill down dimension. Just click on the field you want (2 or more) and then name and click add dimension
- Mark as New
- Bookmark
- Subscribe
- Mute
- Subscribe to RSS Feed
- Permalink
- Report Inappropriate Content
and the above is the automatic drill down way to do this
Another way is to use alternatives (but not available for a table. Maybe use a Pivot Table) The enables a drill around feature. I prefer alternatives (when Im doing a chart for myself) as I'm in control. I don't have to follow the preset drill down
For example if I drill by
Product
Sub Product
Customer
with alternative I can drill by Products to Customers if I want to. Or view all sub-products or customers
But if I'm setting a chart up for other users I often pre-set the sequence.
- Mark as New
- Bookmark
- Subscribe
- Mute
- Subscribe to RSS Feed
- Permalink
- Report Inappropriate Content
Count(distinct total(customer)) would give you all of the customers, regardless of line. What you want is...
Count(Distinct customer) ...that's it!
- Mark as New
- Bookmark
- Subscribe
- Mute
- Subscribe to RSS Feed
- Permalink
- Report Inappropriate Content
Hi Robert,
Thank you very much for the help.
The chart has three fields: product type, sum([totalsales]) and count(distinct total [product]).
Basically we want below result.
1. At product level, we have product type, sum([totalsales]) and count(distinct total [product])
2. Drill down to sub product level, we have product type, sum([totalsales]) and count(distinct total [sub product])
Is there anyway to achieve this?
Kind Regards
Lisa
- Mark as New
- Bookmark
- Subscribe
- Mute
- Subscribe to RSS Feed
- Permalink
- Report Inappropriate Content
Hi Lisa
Not as you have stated above. Unless it can be done using an extension (although what sort of chart do you want).
One option to do this is just have one dimension (Product Type) and three measures. For example use a combo chart (or a table is another option). With a bar as sum([totalsales]) and maybe use lines as count(distinct total [product]) and count(distinct total [sub product]) (using maybe the secondary axis for the counts).
I would also have a drill down from Product Type to SubProduct. Sort of like this (its one example I have in my demo) but with three measures and drill from Product Type to sub product