Unlock a world of possibilities! Login now and discover the exclusive benefits awaiting you.

- Qlik Community
- :
- Forums
- :
- Analytics & AI
- :
- Products & Topics
- :
- App Development
- :
- % Based stacked bar chart
- Subscribe to RSS Feed
- Mark Topic as New
- Mark Topic as Read
- Float this Topic for Current User
- Bookmark
- Subscribe
- Mute
- Printer Friendly Page

 benoitgochel
- Mark as New
- Bookmark
- Subscribe
- Mute
- Subscribe to RSS Feed
- Permalink
- Report Inappropriate Content
% Based stacked bar chart
Hi all,
I have a stacked bar chart with two dimensions (Employee and SubGroupProject) in order to analyze the timesheets of the employees.
The timesheets are transactions lines with a quantity of hours and a projet-subGroupProjet-GroupProjetc.
I would like to show with a stacked bar chart the repartition in % of subGroupProject for each employee.
Eg :
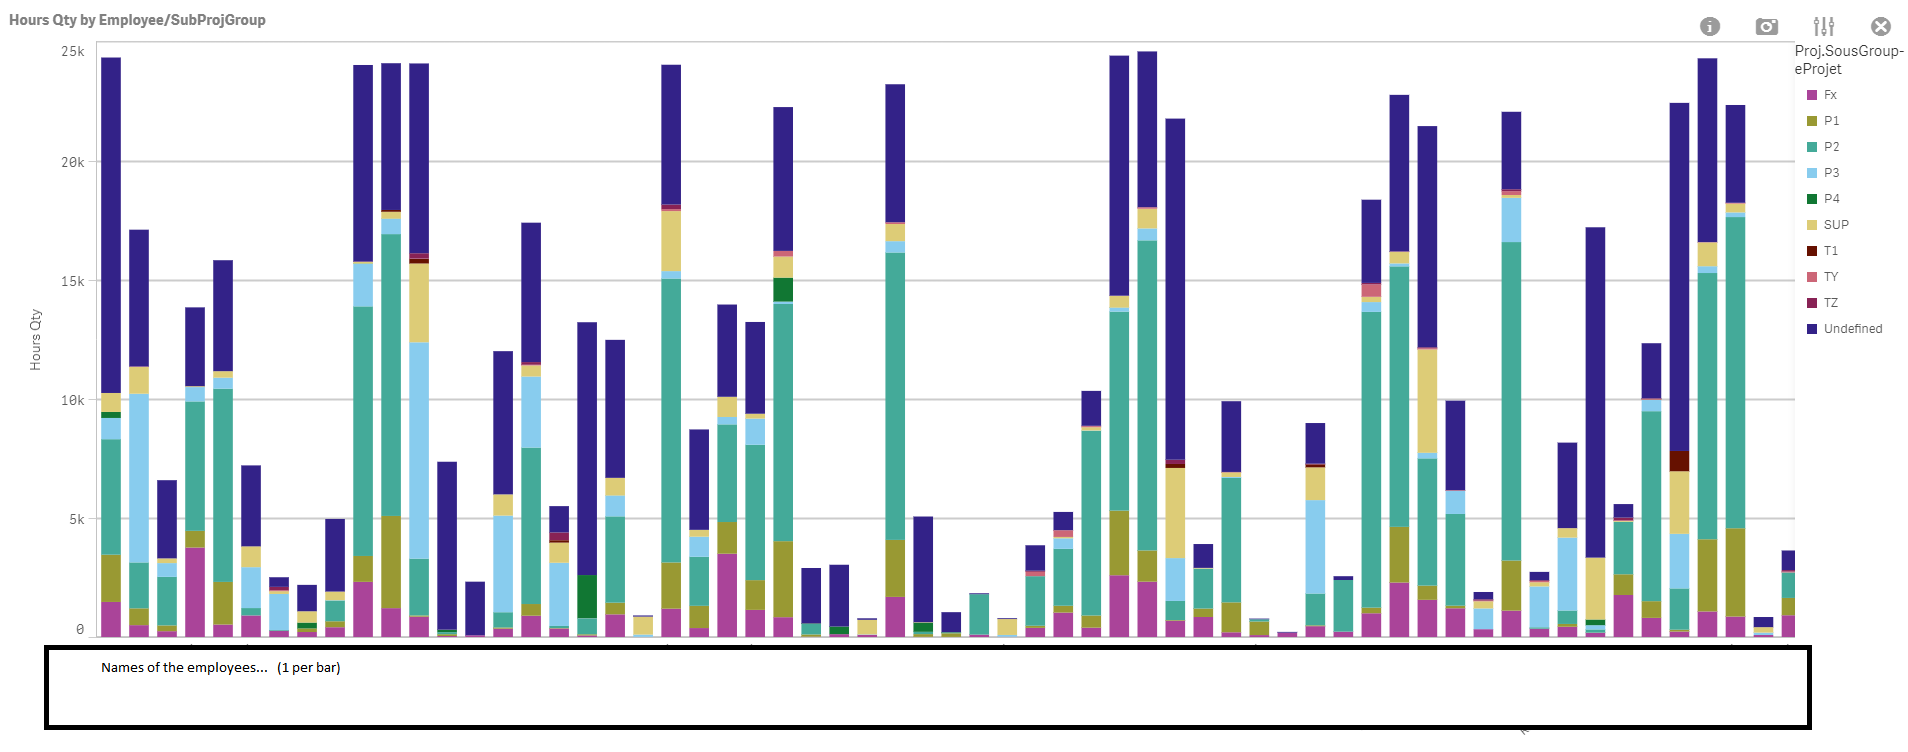
But with % repartition for every employee.
I tried :
=num(SUM([#Hours.QTY])/SUM(TOTAL(<[empl.name]>[#Hours.QTY]))) as my meseaure expression
But I got no result ...
What can I do to solve this?
Thank you in advance,
Accepted Solutions

 sunny_talwar
- Mark as New
- Bookmark
- Subscribe
- Mute
- Subscribe to RSS Feed
- Permalink
- Report Inappropriate Content

 shraddha_g
- Mark as New
- Bookmark
- Subscribe
- Mute
- Subscribe to RSS Feed
- Permalink
- Report Inappropriate Content
Please Share sample app or sample data
sunny_talwar
- Mark as New
- Bookmark
- Subscribe
- Mute
- Subscribe to RSS Feed
- Permalink
- Report Inappropriate Content
Try this
=Num(Sum([#Hours.QTY])/Sum(TOTAL<[empl.name]> [#Hours.QTY]))
benoitgochel
- Mark as New
- Bookmark
- Subscribe
- Mute
- Subscribe to RSS Feed
- Permalink
- Report Inappropriate Content
It worked.
Thank you very much.
