Unlock a world of possibilities! Login now and discover the exclusive benefits awaiting you.
- Qlik Community
- :
- Forums
- :
- Analytics
- :
- App Development
- :
- Calculate new records of a table.
- Subscribe to RSS Feed
- Mark Topic as New
- Mark Topic as Read
- Float this Topic for Current User
- Bookmark
- Subscribe
- Mute
- Printer Friendly Page
- Mark as New
- Bookmark
- Subscribe
- Mute
- Subscribe to RSS Feed
- Permalink
- Report Inappropriate Content
Calculate new records of a table.
Hello.
I have a table with records and I would like work with new recors, the results of some of them minus others.
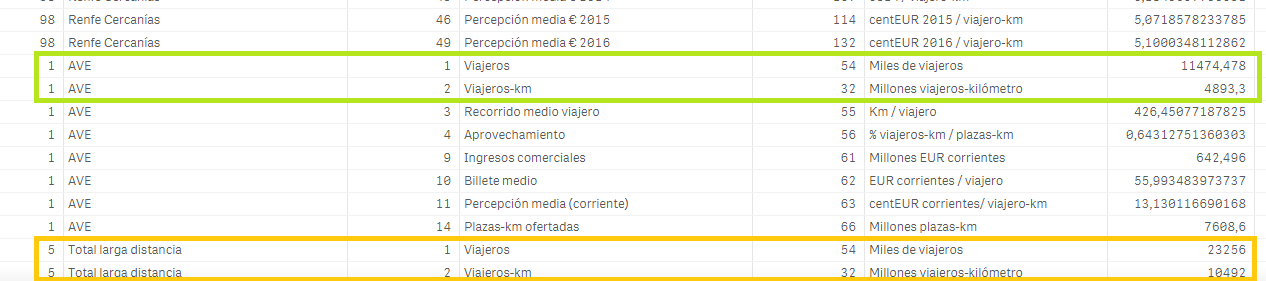
For example, I want to show the result of orange section minus the green section. I do not know if this is better done in the data load script (add new records in the table), or work in the chart/pivot table expresions . The desired result would be to show the two sections indicated and the new section.
Can someone help me?
Thanks and regards.
- Mark as New
- Bookmark
- Subscribe
- Mute
- Subscribe to RSS Feed
- Permalink
- Report Inappropriate Content
Can you share sample qvf and the expected output?
- Mark as New
- Bookmark
- Subscribe
- Mute
- Subscribe to RSS Feed
- Permalink
- Report Inappropriate Content
Finaly I did:
if([VW_TRV_FER.Producto]='Total larga distancia',Sum( {<[VW_TRV_FER.Producto] = {'Total larga distancia'}>} valor ) - Sum( {<[VW_TRV_FER.Producto] = {'AVE'}>} valor ))
It's works in single chart. But then I tryed put it in other with more restrictions, and it didnt work. The second part passed to be negative in the chart (example: firts chart 12-2 = 10 ; In second chart 12-2 = 12 and -2 ). So it maybe need more investigation.
Thanks and regards.