Unlock a world of possibilities! Login now and discover the exclusive benefits awaiting you.

- Qlik Community
- :
- Forums
- :
- Analytics & AI
- :
- Products & Topics
- :
- App Development
- :
- Can this chart be build in Qlik Sense/Gantt Chart
- Subscribe to RSS Feed
- Mark Topic as New
- Mark Topic as Read
- Float this Topic for Current User
- Bookmark
- Subscribe
- Mute
- Printer Friendly Page

 Sagar6
- Mark as New
- Bookmark
- Subscribe
- Mute
- Subscribe to RSS Feed
- Permalink
- Report Inappropriate Content
Can this chart be build in Qlik Sense/Gantt Chart
Hello,
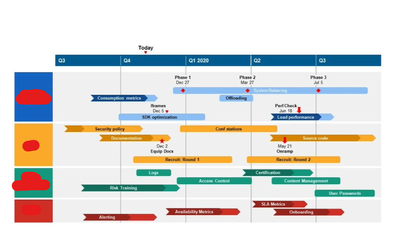
Can someone help if this chart is possible in Qlik Sense On Prem.
Accepted Solutions

 ajaykakkar93
- Mark as New
- Bookmark
- Subscribe
- Mute
- Subscribe to RSS Feed
- Permalink
- Report Inappropriate Content
Hi,
If you want to create a Gantt chart, then can watch the below link
https://www.youtube.com/watch?v=DUcz3q4wf6k
AnyChart is one of the options that can be used
https://www.youtube.com/watch?v=YfJPnuI3WIk

 anychart
- Mark as New
- Bookmark
- Subscribe
- Mute
- Subscribe to RSS Feed
- Permalink
- Report Inappropriate Content
Check out our Gantt Chart extension for Qlik Sense (you can also use it on premises).
ajaykakkar93
- Mark as New
- Bookmark
- Subscribe
- Mute
- Subscribe to RSS Feed
- Permalink
- Report Inappropriate Content
Hi,
If you want to create a Gantt chart, then can watch the below link
https://www.youtube.com/watch?v=DUcz3q4wf6k
AnyChart is one of the options that can be used
https://www.youtube.com/watch?v=YfJPnuI3WIk
anychart
- Mark as New
- Bookmark
- Subscribe
- Mute
- Subscribe to RSS Feed
- Permalink
- Report Inappropriate Content
Check out our Gantt Chart extension for Qlik Sense (you can also use it on premises).
 NS_Qlikupdates
- Mark as New
- Bookmark
- Subscribe
- Mute
- Subscribe to RSS Feed
- Permalink
- Report Inappropriate Content
This type of Gantt-style visualization is possible in Qlik Sense, but it typically requires a custom visualization or extension that supports timelines, task durations, milestones, and dependency tracking.
You may want to check the SenseOps Gantt Chart extension, as it is designed to handle project timeline and scheduling use cases within Qlik Sense and could help achieve a similar layout to the one shown in your screenshot.
Quick Links:
