Unlock a world of possibilities! Login now and discover the exclusive benefits awaiting you.
- Qlik Community
- :
- Forums
- :
- Analytics & AI
- :
- Products & Topics
- :
- App Development
- :
- Change in Target Color based on Budget in Line Cha...
- Subscribe to RSS Feed
- Mark Topic as New
- Mark Topic as Read
- Float this Topic for Current User
- Bookmark
- Subscribe
- Mute
- Printer Friendly Page
- Mark as New
- Bookmark
- Subscribe
- Mute
- Subscribe to RSS Feed
- Permalink
- Report Inappropriate Content
Change in Target Color based on Budget in Line Chart
Hello ,
Please find the code below.
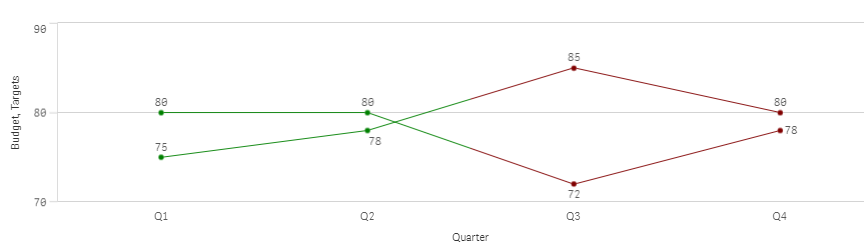
Load * Inline [
KPI,Target,Budget,Quarter
Sales KPI,80,75,Q1
Sales KPI,80,78,Q2
Sales KPI,72,85,Q3
Sales KPI,78,80,Q4
];
I am trying to implement a line chart where the Budget (1st Measure ) should be blue always and the Target(2nd Measure)should be green if Budget is less than Target and Red if Budget is more than Target.
I am getting this kind of Chart below and unable to fullfill the requirement.

Please help me out on this,
Regards,
Pradeep
- Mark as New
- Bookmark
- Subscribe
- Mute
- Subscribe to RSS Feed
- Permalink
- Report Inappropriate Content
Hi,
Good Day😊
Do not change the background color of the budget. Change color only for the target expression,
Provide the below code in background color expression tab of the target expression
= if(Budget<Target, Green(), Red())
And the color is changed as per your requirement.
Regards,
DurgadeviKumar
- Mark as New
- Bookmark
- Subscribe
- Mute
- Subscribe to RSS Feed
- Permalink
- Report Inappropriate Content
Hi,
Thank you for your response.
We are unable to find that option in Qliksense to change only the specific measure based on expression
= if(Budget<Target, Green(), Red()).
Please provide us the screenshot on the same.
Thanks,
Pradeep
- Mark as New
- Bookmark
- Subscribe
- Mute
- Subscribe to RSS Feed
- Permalink
- Report Inappropriate Content
You can find it in appearance

- Mark as New
- Bookmark
- Subscribe
- Mute
- Subscribe to RSS Feed
- Permalink
- Report Inappropriate Content
Hi Bro,
Thank you for the response.
I tried using the same, but the changes are happening for both the measures. I need the Budget in Blue and Target based on Calculation.
Regards,
Pradeep

- Mark as New
- Bookmark
- Subscribe
- Mute
- Subscribe to RSS Feed
- Permalink
- Report Inappropriate Content
may be below will help as there is no direct way to change the color.
https://community.qlik.com/t5/New-to-Qlik-Sense/Color-by-Expression-Problem/m-p/1140597#1074046
- Mark as New
- Bookmark
- Subscribe
- Mute
- Subscribe to RSS Feed
- Permalink
- Report Inappropriate Content
Hi Pradeep,
If possible, you should define Budget and Target as dimensions in the script.
Then you can specify Budget as blue and Target as calculated color in the "colors and legend" expression.
The idea is to be able to filter the records while colorizing the line.