Unlock a world of possibilities! Login now and discover the exclusive benefits awaiting you.
- Qlik Community
- :
- Forums
- :
- Analytics & AI
- :
- Products & Topics
- :
- App Development
- :
- Chart today's date
- Subscribe to RSS Feed
- Mark Topic as New
- Mark Topic as Read
- Float this Topic for Current User
- Bookmark
- Subscribe
- Mute
- Printer Friendly Page
- Mark as New
- Bookmark
- Subscribe
- Mute
- Subscribe to RSS Feed
- Permalink
- Report Inappropriate Content
Chart today's date
Hi Community,
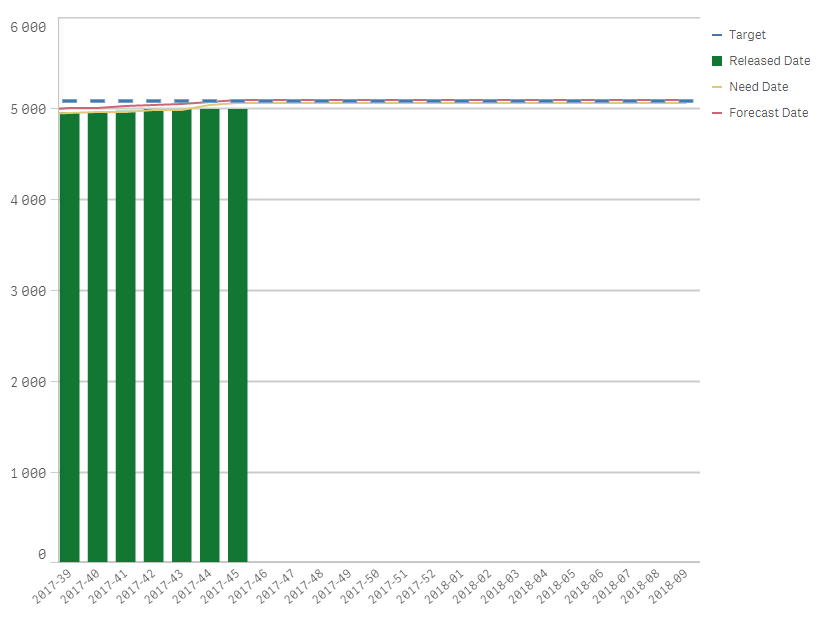
After loading data, I put a combined Chart in order to visualize dates, good. I'd like to know if it's possible to display the chart at the today's date because when I open the app, I have to scroll until fouding my dates :
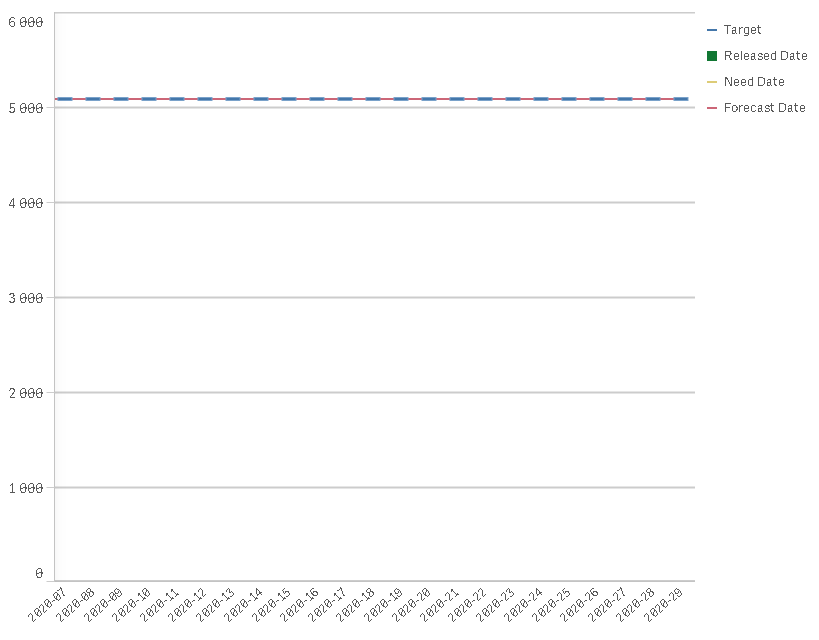 -->
--> 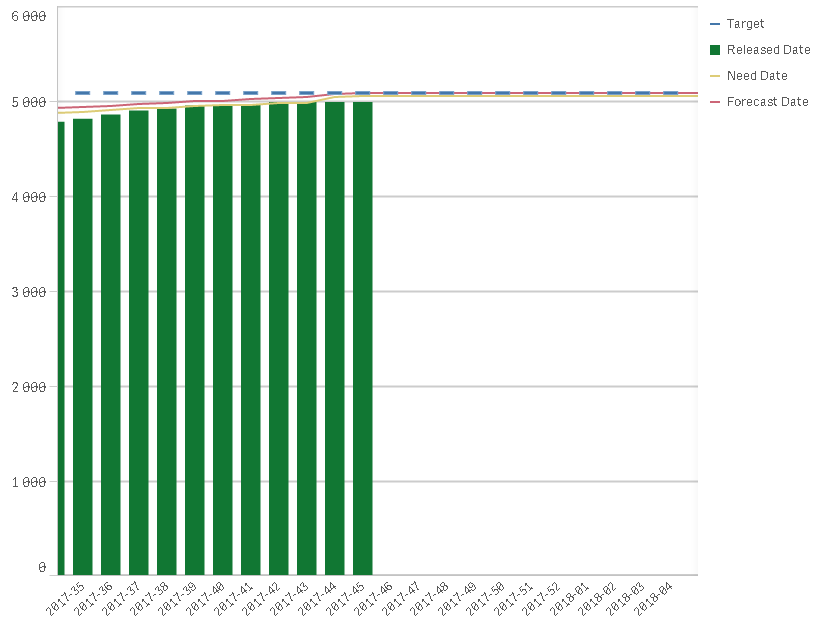
Do you have an idea ?
Thank you,
Victor
- Tags:
- chart today date
- Mark as New
- Bookmark
- Subscribe
- Mute
- Subscribe to RSS Feed
- Permalink
- Report Inappropriate Content
you have to use the sorting option, and use sorting expressions, maybe like this:
Max(DATE_FIELD) DESC
- Mark as New
- Bookmark
- Subscribe
- Mute
- Subscribe to RSS Feed
- Permalink
- Report Inappropriate Content
Also under Presentation you can set the Scroll Alignment to Start or End.
This was introduced a few version ago and I find it very useful on occasion.
Maybe not be what you are after though if you have loads of future dates.
- Mark as New
- Bookmark
- Subscribe
- Mute
- Subscribe to RSS Feed
- Permalink
- Report Inappropriate Content
Thanks for your reply,
If I put :
Max(CanonicalWeekYear)<'2017-50' in the sorting expression of my dimension (CanonicalWeekYear) nothing happen, how would you formulate ?
- Mark as New
- Bookmark
- Subscribe
- Mute
- Subscribe to RSS Feed
- Permalink
- Report Inappropriate Content
Yes i already try this nice option but it still to far from my today's data
- Mark as New
- Bookmark
- Subscribe
- Mute
- Subscribe to RSS Feed
- Permalink
- Report Inappropriate Content
in the sorting area (i forget where it is exactly on qliksense), just put Max(CanonicalWeekYear) (with DESC option)
- Mark as New
- Bookmark
- Subscribe
- Mute
- Subscribe to RSS Feed
- Permalink
- Report Inappropriate Content
Unfortunately I don't think it is possible out of the box then.
Could be done in a bespoke extension, but I have not seen any such open source extension out in the wild.
- Mark as New
- Bookmark
- Subscribe
- Mute
- Subscribe to RSS Feed
- Permalink
- Report Inappropriate Content
I see what you mean,
but it doesn't work, even if i put a date in the expression.
thks
- Mark as New
- Bookmark
- Subscribe
- Mute
- Subscribe to RSS Feed
- Permalink
- Report Inappropriate Content
Would it work to limit the chart to only a small number of future dates? If you don't want to see them, then why not use set analysis to filter them out?
- Mark as New
- Bookmark
- Subscribe
- Mute
- Subscribe to RSS Feed
- Permalink
- Report Inappropriate Content
I finally did that and it works well... Giving a view of 100 days using max(today(1)+100) as maxDate