Unlock a world of possibilities! Login now and discover the exclusive benefits awaiting you.
- Qlik Community
- :
- Forums
- :
- Analytics
- :
- App Development
- :
- Re: Clarification on set analysis use of P() for c...
- Subscribe to RSS Feed
- Mark Topic as New
- Mark Topic as Read
- Float this Topic for Current User
- Bookmark
- Subscribe
- Mute
- Printer Friendly Page
- Mark as New
- Bookmark
- Subscribe
- Mute
- Subscribe to RSS Feed
- Permalink
- Report Inappropriate Content
Clarification on set analysis use of P() for current dimension value
Hello community!
I've gotten myself stuck with set analysis - I think in my use case I need to use the P(), but it seems like I am just not quite grasping how to accomplish it.
Overview - In my data I have what is basically a list of what customers have purchased. I would like to summarize this by displaying how much customers have spent (in total, and avg per customer) on a given type of product (for example, Milk and Cheese = "Dairy") when they have purchased product ABC (ABC is technically any of the values for the dimension product).
In my attached file, I have a sample of the data, and an idea on what I am trying to accomplish...it is roughly something like this:
Data (Purchases)
| Customer | Product | Type of Product | Amount Spent |
|---|---|---|---|
| A | Milk | Dairy | 10 |
| A | Potatoes | Produce | 25 |
| A | Cheese | Dairy | 10 |
| B | Milk | Dairy | 15 |
| B | Oranges | Produce | 35 |
Desired output:
Note: the way I have been thinking about this is that this is a table visualization, with the Product column populated from the dimension "Product" from my sample data, and the "For customers who bought this..." columns, I am writing a set expression for the Types I want to include that is something like this:
sum( {< [Product] =, [Type of Product] = [<Value of desired type of product, ie/ Dairy>] >} Amount Spent)
It feels like I need something like:
sum( {< [Product] =, [Type of Product] = [<Value of desired type of product, ie/ Dairy>], Customer = p( {< [Type of Product] = [<Value of desired type of product, ie/ Dairy>] >} Customer) >} Amount Spent)
| Product | For customers who bought this product, how much did they spend on Dairy? | For customers who bought this product, how much did they spend on Produce? |
|---|---|---|
| Milk | 10+10+15 | 25+35 |
| Oranges | 10+10+15 | 35 |
| Cheese | 10+10 | 25 |
For some reason, I can't quite get the results I want. Any support would be appreciated! My attached excel file has more detail/a more comprehensive example....
- Tags:
- set analysis*
- Mark as New
- Bookmark
- Subscribe
- Mute
- Subscribe to RSS Feed
- Permalink
- Report Inappropriate Content
Hi,
I think it's correct with your desired output :
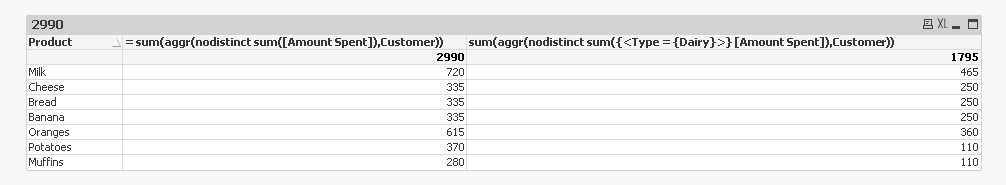
P() is not convenient because it's related with selection,
here is aggr used
regards
- Mark as New
- Bookmark
- Subscribe
- Mute
- Subscribe to RSS Feed
- Permalink
- Report Inappropriate Content
Hi Dan, you could use this expression.
Once for each Type
example:
IF(sum({$<Type ={'Dairy'} >} [Amount Spent]) > '0',SUM({<Type = {'Dairy'}>}[Amount Spent]),0)
IF(sum({$<Type ={'Bakery'} >} [Amount Spent]) > '0',SUM({<Type = {'Bakery'}>}[Amount Spent]),0)
- Mark as New
- Bookmark
- Subscribe
- Mute
- Subscribe to RSS Feed
- Permalink
- Report Inappropriate Content
Olivier, Pablo - thank you both for your replies. Both of your solutions did correctly solve the example I provided, and these were helpful solutions in achieving my goal. My exact scenario was a bit more complex than I had the example (as I realized while working through it) to be, but I was able to leverage what you outlined to solve my challenge.
thanks again,
DD
- Mark as New
- Bookmark
- Subscribe
- Mute
- Subscribe to RSS Feed
- Permalink
- Report Inappropriate Content
Hi, Dan, try this expression for Dairy
Sum(Aggr(Sum(TOTAL < Customer > Aggr(Sum({< Type = {'Dairy'} >} [Amount Spent]), Customer) ), Product, Customer, Type))
