Unlock a world of possibilities! Login now and discover the exclusive benefits awaiting you.
- Qlik Community
- :
- Forums
- :
- Analytics & AI
- :
- Products & Topics
- :
- App Development
- :
- Clustered and stacked bar chart in Qlik Sense
- Subscribe to RSS Feed
- Mark Topic as New
- Mark Topic as Read
- Float this Topic for Current User
- Bookmark
- Subscribe
- Mute
- Printer Friendly Page
- Mark as New
- Bookmark
- Subscribe
- Mute
- Subscribe to RSS Feed
- Permalink
- Report Inappropriate Content
Clustered and stacked bar chart in Qlik Sense
Hello there,
I would like to know if someone could tell me by which way I can make a clustered and stacked bar chart as it has been done in this post : Clustered-Stacked Column and Bar Charts in QlikView (but ... for Qlik Sense )
I have to export an excel file with this kind of graph into a qlik sense application and I must keep this structure which looks like this :
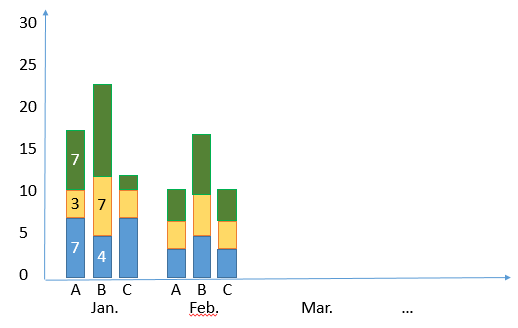
So there is 2 dimensions (the type and the date), 4 stackable measures (even if I only display 3 in my example) with values in the bar portions for each measure (which could be displayed by tool tips) and the Sum on the Y axis.
I hope I'm clear enough for you to help me ! I tried some extensions (3D visualisation library and dygraph) but without success 
Thank you ! 
[EDIT] Ideally I need to set 3 dimensions (the type (A, B or C in my example), the month and the year.
I find a way to do it but it's not sexy and without added value to the Excel file. I've set in the dimension a concatenation of the year, the month et and type ( =Date(mydate, 'YYYY-MM') & ' ' & Type ) then I've sorted by alphabetic.... It's not really grouped and it's a bit ugly 
Accepted Solutions
- Mark as New
- Bookmark
- Subscribe
- Mute
- Subscribe to RSS Feed
- Permalink
- Report Inappropriate Content
Hi Jérémy,
Yes it is not allowed.
If you have just one measure, adding the second dimension will be allowed, (but it is not solve your problem )
G.
- Mark as New
- Bookmark
- Subscribe
- Mute
- Subscribe to RSS Feed
- Permalink
- Report Inappropriate Content
Hi Jérémy,
You achieve the clustered and stacked chart by adding more than two dimension to barchart. This is not possible yet in Qlik Sense.
G.
- Mark as New
- Bookmark
- Subscribe
- Mute
- Subscribe to RSS Feed
- Permalink
- Report Inappropriate Content
Qlik sense limited to use only 2 dimensions at a time... Limitation in Qlik sense
- Mark as New
- Bookmark
- Subscribe
- Mute
- Subscribe to RSS Feed
- Permalink
- Report Inappropriate Content
Hello, thanks for replied !
In my case I don't need more than 2 dimensions. 2 would be enough to get clustered and stacked bar :
One dimension global : The date
The other one for the group : The type
The stacked would only need these two dimensions and all measures that have to be stacked.
The problem is I can't set two dimensions in bar chart. Only one is allowed
For now, I use the concat strings to get my "clustered" (even if they are not really clustered) and stacked bar chart
- Mark as New
- Bookmark
- Subscribe
- Mute
- Subscribe to RSS Feed
- Permalink
- Report Inappropriate Content
Hi Jérémy,
Yes it is not allowed.
If you have just one measure, adding the second dimension will be allowed, (but it is not solve your problem )
G.
- Mark as New
- Bookmark
- Subscribe
- Mute
- Subscribe to RSS Feed
- Permalink
- Report Inappropriate Content
Hello Gadwinjer,
I'm new to QlikSense and also trying to insert a clusterd and stacked bar chart. Could you explain further how you use concat strings to get the "clustered" view in your case? I attach an image of what I'm looking for (with the graph made in excel). Basically, I'd like to group the columns of "Actual" and "Forecast", and stack the different parts (Actual 1, 2 3 and 4; and, separately, Forecast 1, 2, 3 and 4). If I understand properly, the X-Axis corresponds to the dimension "City", in this example, right? So... can I do the grouping and stacking with measures and concat?
Thanks in advance!
