Unlock a world of possibilities! Login now and discover the exclusive benefits awaiting you.
- Qlik Community
- :
- Forums
- :
- Analytics & AI
- :
- Products & Topics
- :
- App Development
- :
- Color Line Chart by Segmented Colors in Master Mea...
- Subscribe to RSS Feed
- Mark Topic as New
- Mark Topic as Read
- Float this Topic for Current User
- Bookmark
- Subscribe
- Mute
- Printer Friendly Page
- Mark as New
- Bookmark
- Subscribe
- Mute
- Subscribe to RSS Feed
- Permalink
- Report Inappropriate Content
Color Line Chart by Segmented Colors in Master Measures
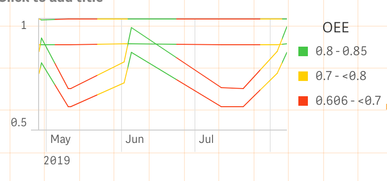
I have created 4 master measures, each defined with segmented colors with the same range and colors. I want to place all 4 of them on a line chart and color each line independently by this range.
i.e. for any given line value, if it's above .9 I want the line to be green, if its below .7 I want it to be red, and if its in between these values I want it to be yellow.
I assume color by measure is out of the question because this will change every line to the colors of one - as shown below. I
I know how to apply the segmented colors using if() expressions, so my question is how to independently color multiple lines by expression in the same chart.
- Mark as New
- Bookmark
- Subscribe
- Mute
- Subscribe to RSS Feed
- Permalink
- Report Inappropriate Content
Hi there,
I think I posted the same kind of question yesterday:
Color measurements in line chart by color - Qlik Community - 1894294
Did you find a solution to your challenge?
Kind regards,
Sebb.
