Unlock a world of possibilities! Login now and discover the exclusive benefits awaiting you.
- Qlik Community
- :
- Forums
- :
- Analytics & AI
- :
- Products & Topics
- :
- App Development
- :
- Color by expressions - How to show greater than av...
- Subscribe to RSS Feed
- Mark Topic as New
- Mark Topic as Read
- Float this Topic for Current User
- Bookmark
- Subscribe
- Mute
- Printer Friendly Page
- Mark as New
- Bookmark
- Subscribe
- Mute
- Subscribe to RSS Feed
- Permalink
- Report Inappropriate Content
Color by expressions - How to show greater than average
Hi,
I would like to have conditional formatting in my QlikSense bar chart so that when the output is significantly greater than the average, it is a distinct color.
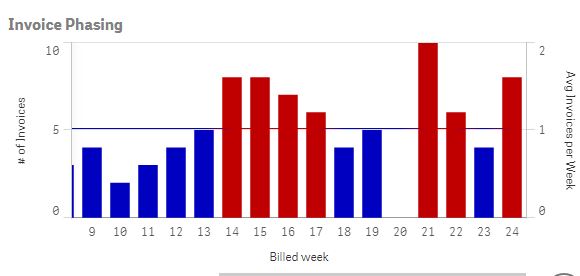
I have a bar graph with # of invoices processed by week. I included a line chart with the average invoices processed by week with the expression: Count([Invoice #])/Count([Billed week])
For the color by expression in the bar chart, I tried
if(Count("Invoice #") > (Count([Invoice #])/Count([Billed week])*1.25)
,rgb(192,0,0)
,rgb(0,0,192)
)
This results in every bar being red, as it doesn't look at the unique count for that week. If I change the second part of the formula to a # instead of the expression, for example
if(Count("Invoice #") > 5,
,rgb(192,0,0)
,rgb(0,0,192)
)
works with any weeks with more than 5 invoices being red. Any suggestions to update the first part of the formula to only look at the count of unique billing weeks?
Thanks,
Dave
- Mark as New
- Bookmark
- Subscribe
- Mute
- Subscribe to RSS Feed
- Permalink
- Report Inappropriate Content
What dimensions do you have on your chart?
- Mark as New
- Bookmark
- Subscribe
- Mute
- Subscribe to RSS Feed
- Permalink
- Report Inappropriate Content
Dimension is billed week
- Mark as New
- Bookmark
- Subscribe
- Mute
- Subscribe to RSS Feed
- Permalink
- Report Inappropriate Content
Since I dont have a sample data, here is an approximation of what you need
- Mark as New
- Bookmark
- Subscribe
- Mute
- Subscribe to RSS Feed
- Permalink
- Report Inappropriate Content
I tried using the expression in the file you attached but am not having any success. I've moved the data into a new file which is uploaded below, please let me know if that helps shed some light on what I'm doing.
- Mark as New
- Bookmark
- Subscribe
- Mute
- Subscribe to RSS Feed
- Permalink
- Report Inappropriate Content
Hi, I took the liberty on changing the formula for your average since checking the data I notice that when you count the number of Invoice over the number of Billed Week, i.e week 1 has 5 invoices then the formula result would be
[Invoice #]/[Billed Weeek]*1.25 = 5/5*1.25=1.25
So what I did was calculate the total avg of invoices per week
Pls see attached file