Unlock a world of possibilities! Login now and discover the exclusive benefits awaiting you.
- Qlik Community
- :
- Forums
- :
- Analytics & AI
- :
- Products & Topics
- :
- App Development
- :
- ColorMapHue - Usage
- Subscribe to RSS Feed
- Mark Topic as New
- Mark Topic as Read
- Float this Topic for Current User
- Bookmark
- Subscribe
- Mute
- Printer Friendly Page
- Mark as New
- Bookmark
- Subscribe
- Mute
- Subscribe to RSS Feed
- Permalink
- Report Inappropriate Content
ColorMapHue - Usage
Hello All,
I have 4 Buttons which pulls up distinct values from 4 Dimensions Eg: Sex, AgeGroup, Race and Country
I have a Scatter Plot where I have to show all employees based on No of Days Working in a Year and No of Leaves Taken in a Year.
What I need is if I click on any of the aforesaid buttons - the colour of employees should change accordingly.
So - If I select Sex - The entire Scatter Graph will have 2 colours - assuming M and F, If I select Race - and if there are 4 races, the Graph will have 4 colours.
Now I have been trying to do with ColorMapHue and I have taken Startpoint as 0, Endpoint as 1 and Steps as 1/ (
if(DemDi=1, count({<DemDi=1>} distinct Sex),
if(DemDi=2, count({<DemDi=2>} distinct Race),
if(DemDi=3, count({<DemDi=3>} distinct [Age Group]),
if(DemDi=4, count({<DemDi=4>} distinct Country)))))
)
So Steps will give me 0.5 for Sex and so on.
However I am unable to achieve the result - all is coming as Red.
Requesting anyone to help.
- Mark as New
- Bookmark
- Subscribe
- Mute
- Subscribe to RSS Feed
- Permalink
- Report Inappropriate Content
Hi,
From the appearance on the right hand pane select colours and legend and choose colours by custome and select By dimension screen shot below:
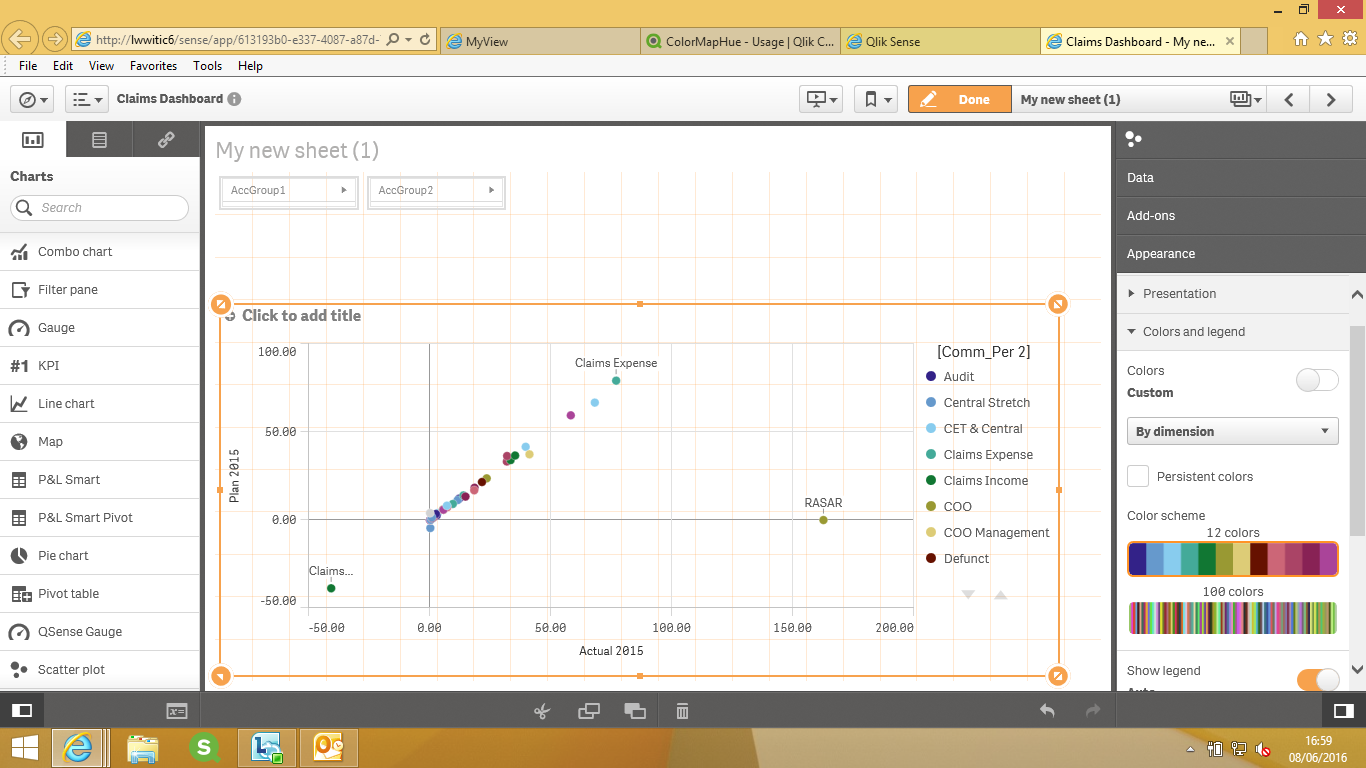
Thanks
- Mark as New
- Bookmark
- Subscribe
- Mute
- Subscribe to RSS Feed
- Permalink
- Report Inappropriate Content
Hello Chandrasheker Gompa,
Thanks a Lot for the Swift reply. However this is not the exact solution I was looking for.
Let me give you a Hint.
