Unlock a world of possibilities! Login now and discover the exclusive benefits awaiting you.
- Qlik Community
- :
- Forums
- :
- Analytics & AI
- :
- Products & Topics
- :
- App Development
- :
- ColorMix in Matrix PivotTable
- Subscribe to RSS Feed
- Mark Topic as New
- Mark Topic as Read
- Float this Topic for Current User
- Bookmark
- Subscribe
- Mute
- Printer Friendly Page
- Mark as New
- Bookmark
- Subscribe
- Mute
- Subscribe to RSS Feed
- Permalink
- Report Inappropriate Content
ColorMix in Matrix PivotTable
Hi all,
I want to highlight values in a pivot table which is build as follows:
lines: different weight bands
columns: different destintations/zones
I currently use the following formula:
ColorMix2( (rank(total column(1))/(noofrows(TOTAL)/2))-1 ,rgb(0,70,155), rgb(204,224,238),rgb(242,242,242))
This one is only referencing on each single row.
I want it to reference on the whole matrix, so that eg. zone 5 / weight 301-400kg = 5 and zone 6 / weight 801-900kg = 5 are shown with the same background color.
Which expression do I need to use for that?
- « Previous Replies
-
- 1
- 2
- Next Replies »
Accepted Solutions
- Mark as New
- Bookmark
- Subscribe
- Mute
- Subscribe to RSS Feed
- Permalink
- Report Inappropriate Content
Try with:
colorMix1(count([Shipment no])/Max(TOTAL Aggr(count([Shipment no]), [Weight Band], [Zone])),rgb(0,70,155), rgb(204,224,238))
Maybe colors have to be switched.
- Mark as New
- Bookmark
- Subscribe
- Mute
- Subscribe to RSS Feed
- Permalink
- Report Inappropriate Content
Hi Markus, I think it's because the "noofrows(TOTAL)" it's returning a different value by column, can you check adding it to a new expression?
In that case maybe you can try with "Count(TOTAL FieldName)" or similar that returns the same value in all cells.
- Mark as New
- Bookmark
- Subscribe
- Mute
- Subscribe to RSS Feed
- Permalink
- Report Inappropriate Content
Hi,
with Count (TOTAL ...) I get the followin:
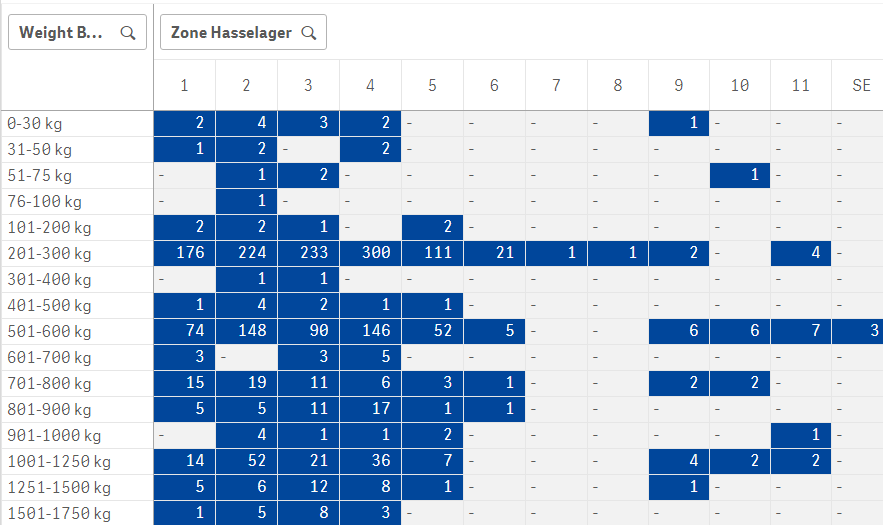
Unfortunately not what I need 
- Mark as New
- Bookmark
- Subscribe
- Mute
- Subscribe to RSS Feed
- Permalink
- Report Inappropriate Content
I don't know why it's not working, can you share a sample?
Or maybe creating a variable with "=Count(FieldName)" and the expression "$(VariableName)"
- Mark as New
- Bookmark
- Subscribe
- Mute
- Subscribe to RSS Feed
- Permalink
- Report Inappropriate Content
I am not allowed to share due to comapny policies...
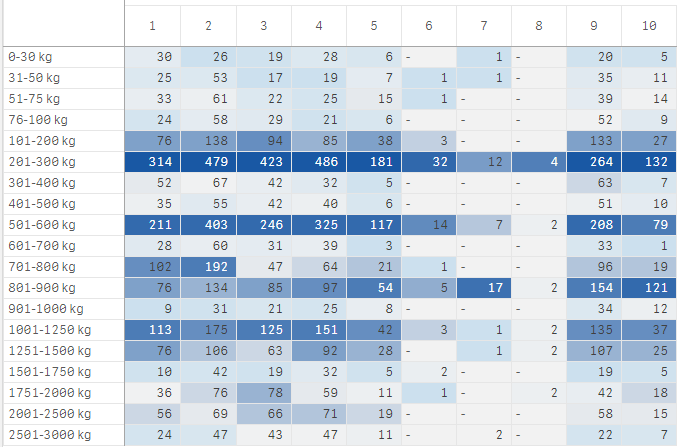
the formula for the above shown screenshot is:
ColorMix2( (rank(total column(1))/(count(TOTAL [Shipment no])/2))-1 ,rgb(0,70,155), rgb(204,224,238),rgb(242,242,242))
However, I rearranged the formula as follows:
ColorMix2( (rank(total count ([Shipment no]))/(Count( [Shipment no])))-1 ,rgb(0,70,155), rgb(204,224,238),rgb(242,242,242))
this is giving me
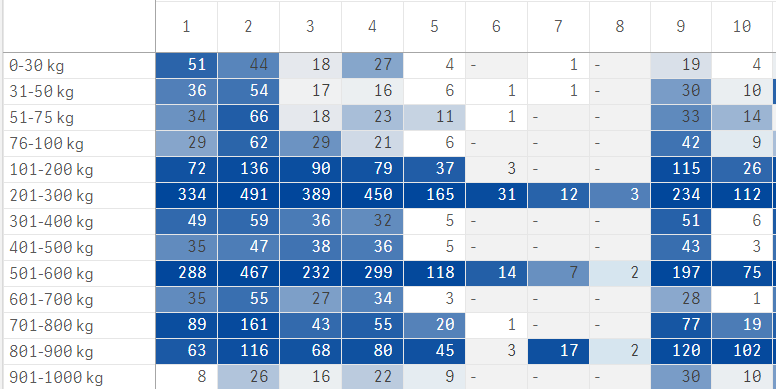
This looks better now bit still there are different colors for same values (e.g. 3) and the higher values all have the same color...
- Mark as New
- Bookmark
- Subscribe
- Mute
- Subscribe to RSS Feed
- Permalink
- Report Inappropriate Content
And what's the calculated expression? the one that shows the number is also a rank expression?
- Mark as New
- Bookmark
- Subscribe
- Mute
- Subscribe to RSS Feed
- Permalink
- Report Inappropriate Content
I think I need the rank for the ColorMix2 formula.
The calculated expression is the number of shipments or data sets.
Like in an excel pivot table I have e.g. total amount of shipments = 12.830
Filling in the lines, I will see the amounts per weight band.
Adding the Zones as well, I see how many shipments I have per zone / weight band combination. I total they add-up to 12.830.
Maybe the formula stated in the beginning is wrong.. that was just my first unsuccessful try...
- Mark as New
- Bookmark
- Subscribe
- Mute
- Subscribe to RSS Feed
- Permalink
- Report Inappropriate Content
Maybe calculating the percentaje as:
[Shipments of Cell]/[Max Cell value]
For Max cell value you can use aggr:
Max(Aggr([Expression for shipments of cell], Dimension1, diemnsion2...))
You can use a variable to store the expression and use this variable in expressions.
Also, colormix2 is used when you want to use 3 colors using values from -1 to 0 to 1, if there will be no negative values, for going to light grey to blue you can use a simpler ColorMix1:
- Mark as New
- Bookmark
- Subscribe
- Mute
- Subscribe to RSS Feed
- Permalink
- Report Inappropriate Content
ok, ColorMix1 makes sense for sure.
not sure how I should build the formula then.
This
colorMix1( Max(Aggr([Shipment no], [Weight Band], [Zone]) / count([Shipment no])),rgb(0,70,155), rgb(204,224,238))
is not giving a usable solution.
- Mark as New
- Bookmark
- Subscribe
- Mute
- Subscribe to RSS Feed
- Permalink
- Report Inappropriate Content
Try with:
colorMix1(count([Shipment no])/Max(TOTAL Aggr(count([Shipment no]), [Weight Band], [Zone])),rgb(0,70,155), rgb(204,224,238))
Maybe colors have to be switched.
- « Previous Replies
-
- 1
- 2
- Next Replies »