Unlock a world of possibilities! Login now and discover the exclusive benefits awaiting you.
- Qlik Community
- :
- Forums
- :
- Analytics & AI
- :
- Products & Topics
- :
- App Development
- :
- Combo Chart - formula needed to filter out info
- Subscribe to RSS Feed
- Mark Topic as New
- Mark Topic as Read
- Float this Topic for Current User
- Bookmark
- Subscribe
- Mute
- Printer Friendly Page
- Mark as New
- Bookmark
- Subscribe
- Mute
- Subscribe to RSS Feed
- Permalink
- Report Inappropriate Content
Combo Chart - formula needed to filter out info
hello forum,
I would need your help with below challenge.
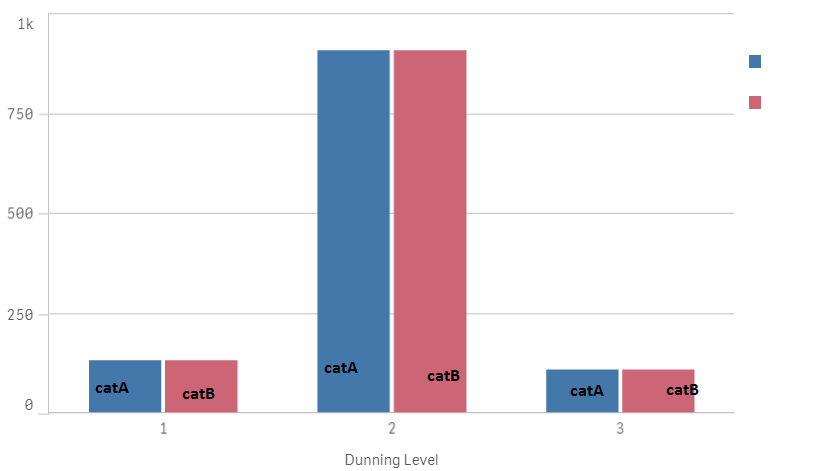
i would need to create a combo chart to show simultaneous 2 categories using Bar chart type.
I know i need to pt some formula to restrict the count for the values for "catA" and respectivelly "catB" but i don't know how.
any help/direction is more than welcome
Accepted Solutions
- Mark as New
- Bookmark
- Subscribe
- Mute
- Subscribe to RSS Feed
- Permalink
- Report Inappropriate Content
Using [Dunning Level] as dimension as you do now and add two expressions for the two categories:
- count({<MyCategory={'catA'}>} MyItem)
- count({<MyCategory={'catB'}>} MyItem)
Replace MyCategory and MyItem with the appropriate field names from your data model.
talk is cheap, supply exceeds demand
- Mark as New
- Bookmark
- Subscribe
- Mute
- Subscribe to RSS Feed
- Permalink
- Report Inappropriate Content
worked like a charm.
thanks a million. can u please suggest some reference materials where I can learn how to build these formulas?
- Mark as New
- Bookmark
- Subscribe
- Mute
- Subscribe to RSS Feed
- Permalink
- Report Inappropriate Content
You can find some information here: A Primer on Set Analysis
talk is cheap, supply exceeds demand