Unlock a world of possibilities! Login now and discover the exclusive benefits awaiting you.
- Qlik Community
- :
- Forums
- :
- Analytics & AI
- :
- Products & Topics
- :
- App Development
- :
- Convert QLikView pie-chart with two expressions to...
- Subscribe to RSS Feed
- Mark Topic as New
- Mark Topic as Read
- Float this Topic for Current User
- Bookmark
- Subscribe
- Mute
- Printer Friendly Page
- Mark as New
- Bookmark
- Subscribe
- Mute
- Subscribe to RSS Feed
- Permalink
- Report Inappropriate Content
Convert QLikView pie-chart with two expressions to QLikSense pie chart
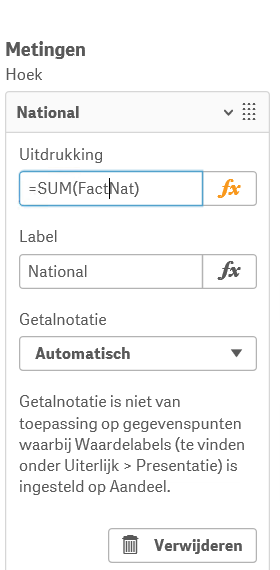
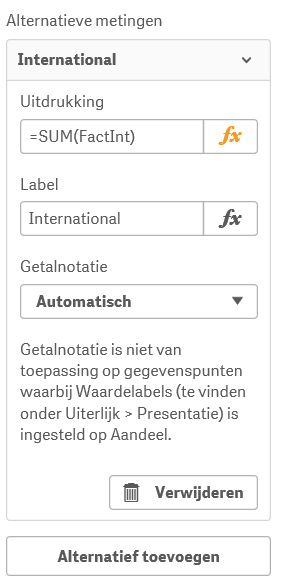
First I made a pie-chart in QLikView that has two expressions but no dimension. The two expression in the chart are: =SUM(FactNat) and =SUM(FactInt).
I tried to create the same chart in QLikSense but my problem is that QLikSense obliged me to create a dimension that the current pie chart doesn't contain.
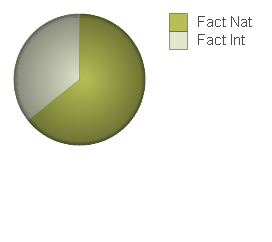
My pie-chart in QLikView
When I added the two expressions to the pie-chart, I don't get a visualization. What do I need to put as dimension to the pie-chart?
I tried to add FactInt as dimension that results to:

And FactNat results to:
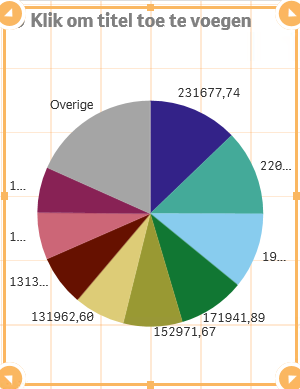
How do I get the pie-chart shown in QLikView?
- Tags:
- pie chart %
Accepted Solutions
- Mark as New
- Bookmark
- Subscribe
- Mute
- Subscribe to RSS Feed
- Permalink
- Report Inappropriate Content
Try this:
As a calculated dimension:
=ValueList('FactNat','FactInt')
As your measure:
if(ValueList('FactNat','FactInt')='FactNat',sum(FactNat),
if(ValueList('FactNat','FactInt')='FactInt',sum(FactInt)))
You will need to do some conditional colouring and labelling
- Mark as New
- Bookmark
- Subscribe
- Mute
- Subscribe to RSS Feed
- Permalink
- Report Inappropriate Content
This is exactly what I needed, thanks.
- Mark as New
- Bookmark
- Subscribe
- Mute
- Subscribe to RSS Feed
- Permalink
- Report Inappropriate Content
Nice one - exactly what I needed