Unlock a world of possibilities! Login now and discover the exclusive benefits awaiting you.
- Qlik Community
- :
- Forums
- :
- Analytics & AI
- :
- Products & Topics
- :
- App Development
- :
- Re: Count customers
- Subscribe to RSS Feed
- Mark Topic as New
- Mark Topic as Read
- Float this Topic for Current User
- Bookmark
- Subscribe
- Mute
- Printer Friendly Page
- Mark as New
- Bookmark
- Subscribe
- Mute
- Subscribe to RSS Feed
- Permalink
- Report Inappropriate Content
Count customers
He.
In my example I need to count the customers where the sum of their sales is greater than 0 and I need to visualize it by different dimensions: time, seller, region, product, etc.
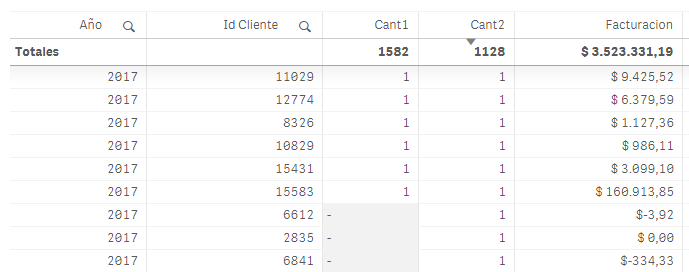
In the column Cant1 I use the formula:if(Sum(Precio * Cantidad * Cotizacion) > 0,count(distinct ID_Cliente)) but 1582 is not the correct total.
I also tried with:Count({$<ID_Cliente= {"=sum(Precio * Cantidad * Cotizacion) > 0"}>} distinct ID_Cliente) but it does not work, when selecting a period it gives a result and when seeing all the periods the result in that period changes.
Other: Count({$<ID_Ticket = {"=sum(Precio * Cantidad * Cotizacion) > 0"}>} distinct ID_Cliente) but takes into account for each ticket and if the sum, for example, of a period is not greater than zero, it counts and should not do so.
Regards.
- « Previous Replies
-
- 1
- 2
- Next Replies »
Accepted Solutions
- Mark as New
- Bookmark
- Subscribe
- Mute
- Subscribe to RSS Feed
- Permalink
- Report Inappropriate Content
Modify your script to this
LOAD AutoNumber(Clave&month(FechaComprobante)&year(FechaComprobante)) as Key,
date(FechaComprobante) as Date,
month(FechaComprobante) as Month,
year(FechaComprobante) as Year,
Clave as ID_Cliente,
idFacturaVtad as Id_tickets,
SitioClienteVta as PuntoVta,
Rubro_id,
idVendedor,
Cantidad
FROM [lib://Forum/Ventas2017.xlsx]
(ooxml, embedded labels, table is Sheet1);
and then use this
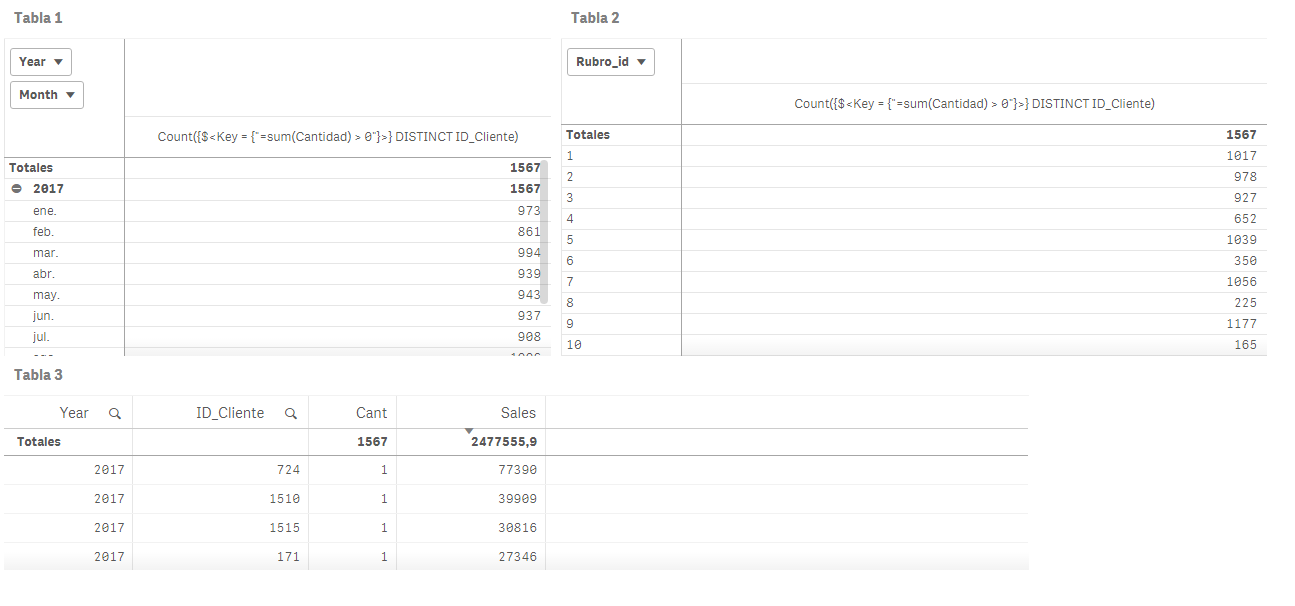
Count({$<Key = {"=sum(Cantidad) > 0"}>} DISTINCT ID_Cliente)
- Mark as New
- Bookmark
- Subscribe
- Mute
- Subscribe to RSS Feed
- Permalink
- Report Inappropriate Content
Please provide sample data and Sample app with expected output
- Mark as New
- Bookmark
- Subscribe
- Mute
- Subscribe to RSS Feed
- Permalink
- Report Inappropriate Content
Try
count(if(Sum(Precio * Cantidad * Cotizacion) > 0,distinct ID_Cliente))
perhabs you need additional an aggregation (aggr)
but to judge that I need more information.
- Mark as New
- Bookmark
- Subscribe
- Mute
- Subscribe to RSS Feed
- Permalink
- Report Inappropriate Content
May be you need this
LOAD ID_Cliente&period as Key
and then this
Count({$<Key = {"=Sum(Precio * Cantidad * Cotizacion) > 0"}>} DISTINCT ID_Cliente)
- Mark as New
- Bookmark
- Subscribe
- Mute
- Subscribe to RSS Feed
- Permalink
- Report Inappropriate Content
Thanks for answering.
But if ID_Cliente&period 1 = $ 100 and ID_Cliente&period 2 = $ -100 you should not count and count it.
I'm going to try to put together a set of data and upload the qvf.
Regards.
- Mark as New
- Bookmark
- Subscribe
- Mute
- Subscribe to RSS Feed
- Permalink
- Report Inappropriate Content
Ya, a sample might help us understand your issue better here
- Mark as New
- Bookmark
- Subscribe
- Mute
- Subscribe to RSS Feed
- Permalink
- Report Inappropriate Content
Hi.
Here is the example qvf.
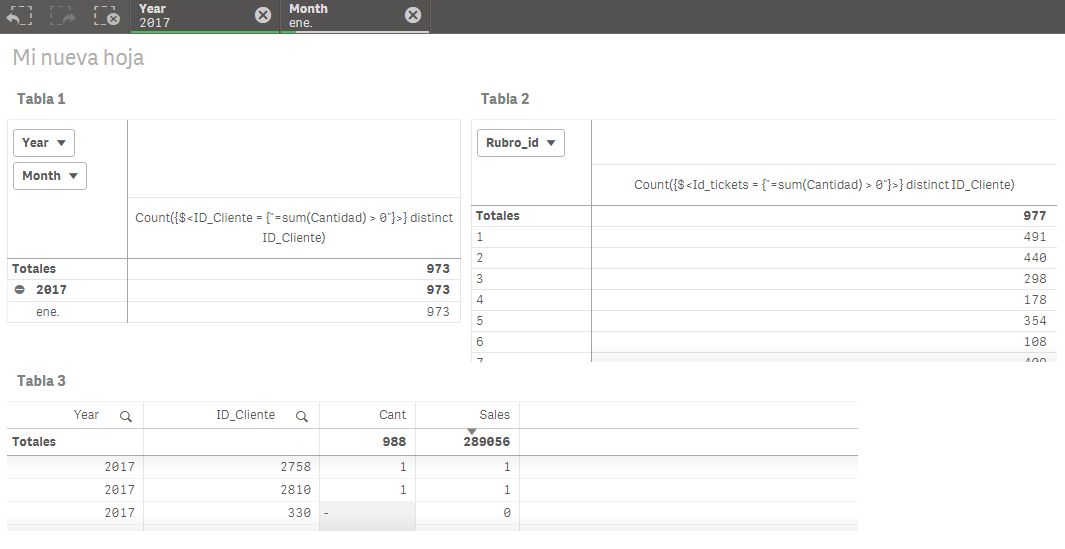
In Table1 it shows the correct result, but if I remove the filter for the month of January, it shows another result for January.
In Table2, dimension Rubro_id, it does not work.
In Table3 the column "Cant" works correctly, but the Total is incorrect.
I would like to show the result alternating several dimensions, not just time.
Regards.
- Mark as New
- Bookmark
- Subscribe
- Mute
- Subscribe to RSS Feed
- Permalink
- Report Inappropriate Content
Hi.
Any help?.
The only way to solve it is using the aggr function?.
Regards.
- Mark as New
- Bookmark
- Subscribe
- Mute
- Subscribe to RSS Feed
- Permalink
- Report Inappropriate Content
Are you shure that 973 is correct for january if you use
if (sum(Cantidad)>0, count(distinct ID_Cliente))
you have allways the same solution in your calculation but its 988 for january.
- Mark as New
- Bookmark
- Subscribe
- Mute
- Subscribe to RSS Feed
- Permalink
- Report Inappropriate Content
Hi.
For January corresponds 973. By selecting January and exporting Table3 to excel, you can count them to 973 clients.
Regards.
- « Previous Replies
-
- 1
- 2
- Next Replies »