Unlock a world of possibilities! Login now and discover the exclusive benefits awaiting you.
- Qlik Community
- :
- Forums
- :
- Analytics & AI
- :
- Products & Topics
- :
- App Development
- :
- Count if using set analysis
- Subscribe to RSS Feed
- Mark Topic as New
- Mark Topic as Read
- Float this Topic for Current User
- Bookmark
- Subscribe
- Mute
- Printer Friendly Page
- Mark as New
- Bookmark
- Subscribe
- Mute
- Subscribe to RSS Feed
- Permalink
- Report Inappropriate Content
Count if using set analysis
Hi there Experts,
Hope someone could help me out.
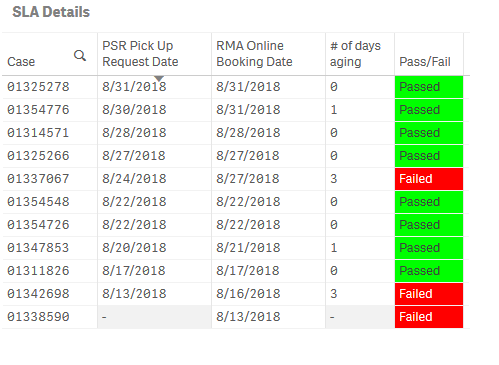
I have a straight table with the following dimensions:
Dimension: Case
Measurements: Set Analysis
PSR Pickup Request Date:
Max({<PSR_or_RMA_Transaction={'PSR'}>}[CreatedDate.autoCalendar.Date])
RMA Online Booking Date:
Max({<PSR_or_RMA_Transaction={'RMA'}>}[CreatedDate.autoCalendar.Date])
# of days aging:
Max({<PSR_or_RMA_Transaction={'RMA'}>}[CreatedDate.autoCalendar.Date]) - Max({<PSR_or_RMA_Transaction={'PSR'}>}[CreatedDate.autoCalendar.Date])
Pass/Fail:
if((Max({<PSR_or_RMA_Transaction={'RMA'}>}[CreatedDate.autoCalendar.Date])-Max({<PSR_or_RMA_Transaction={'PSR'}>}[CreatedDate.autoCalendar.Date]))<=1,'Passed','Failed')
Now, using KPI in my chart:
> I want to count "# of days aging" that are "<=1"
> I want to count "# of days aging" that are ">1"
Thank you so much for your inputs!
Regards,
IC
- « Previous Replies
-
- 1
- 2
- Next Replies »
- Mark as New
- Bookmark
- Subscribe
- Mute
- Subscribe to RSS Feed
- Permalink
- Report Inappropriate Content
My apology Olivier, rookie problem.
Don't know if I got the correct formula below, I wasn't able to get the figures that I want.
sum(total if(Aggr((max({<PSR_or_RMA_Transaction={'RMA'}>}[CreatedDate.autoCalendar.Date])-max({<PSR_or_RMA_Transaction={'PSR'}>}[CreatedDate.autoCalendar.Date])),[CreatedDate.autoCalendar.Week], CaseNumber)<=1,1,0))
Thank you so much for any help.
- Mark as New
- Bookmark
- Subscribe
- Mute
- Subscribe to RSS Feed
- Permalink
- Report Inappropriate Content
I havn't any more datas to test,
what's wrong ?
maybe remove total after sum(
or write sum(total <Week>
- Mark as New
- Bookmark
- Subscribe
- Mute
- Subscribe to RSS Feed
- Permalink
- Report Inappropriate Content
I removed the Total after sum and it worked!
Thank you so much Olivier!!!
- « Previous Replies
-
- 1
- 2
- Next Replies »