Unlock a world of possibilities! Login now and discover the exclusive benefits awaiting you.
- Qlik Community
- :
- Forums
- :
- Analytics & AI
- :
- Products & Topics
- :
- App Development
- :
- Re: Count if using set analysis
- Subscribe to RSS Feed
- Mark Topic as New
- Mark Topic as Read
- Float this Topic for Current User
- Bookmark
- Subscribe
- Mute
- Printer Friendly Page
- Mark as New
- Bookmark
- Subscribe
- Mute
- Subscribe to RSS Feed
- Permalink
- Report Inappropriate Content
Count if using set analysis
Hi there Experts,
Hope someone could help me out.
I have a straight table with the following dimensions:
Dimension: Case
Measurements: Set Analysis
PSR Pickup Request Date:
Max({<PSR_or_RMA_Transaction={'PSR'}>}[CreatedDate.autoCalendar.Date])
RMA Online Booking Date:
Max({<PSR_or_RMA_Transaction={'RMA'}>}[CreatedDate.autoCalendar.Date])
# of days aging:
Max({<PSR_or_RMA_Transaction={'RMA'}>}[CreatedDate.autoCalendar.Date]) - Max({<PSR_or_RMA_Transaction={'PSR'}>}[CreatedDate.autoCalendar.Date])
Pass/Fail:
if((Max({<PSR_or_RMA_Transaction={'RMA'}>}[CreatedDate.autoCalendar.Date])-Max({<PSR_or_RMA_Transaction={'PSR'}>}[CreatedDate.autoCalendar.Date]))<=1,'Passed','Failed')
Now, using KPI in my chart:
> I want to count "# of days aging" that are "<=1"
> I want to count "# of days aging" that are ">1"
Thank you so much for your inputs!
Regards,
IC
- « Previous Replies
-
- 1
- 2
- Next Replies »
Accepted Solutions
- Mark as New
- Bookmark
- Subscribe
- Mute
- Subscribe to RSS Feed
- Permalink
- Report Inappropriate Content
I havn't any more datas to test,
what's wrong ?
maybe remove total after sum(
or write sum(total <Week>
- Mark as New
- Bookmark
- Subscribe
- Mute
- Subscribe to RSS Feed
- Permalink
- Report Inappropriate Content
Hi,
maybe you can reuse Pass/Fail:
for count of <=1 :
sum(total if(aggr((Max({<PSR_or_RMA_Transaction={'RMA'}>}[CreatedDate.autoCalendar.Date])-Max({<PSR_or_RMA_Transaction={'PSR'}>}[CreatedDate.autoCalendar.Date]),Case))<=1,1,0))
regards
- Mark as New
- Bookmark
- Subscribe
- Mute
- Subscribe to RSS Feed
- Permalink
- Report Inappropriate Content
Thank you so much Oliver,
However, I've gotten an "Error in expression" using the same formula
Sum(Total if(aggr((Max({<PSR_or_RMA_Transaction={'RMA'}>}[CreatedDate.autoCalendar.Date])- Max({<PSR_or_RMA_Transaction={'PSR'}>}[CreatedDate.autoCalendar.Date]),CaseNumber))<=1,1,0))
Hope we can check again what went wrong.
Thanks again!
- Mark as New
- Bookmark
- Subscribe
- Mute
- Subscribe to RSS Feed
- Permalink
- Report Inappropriate Content
maybe parenthesis in bold :
Sum(Total if(aggr((Max({<PSR_or_RMA_Transaction={'RMA'}>}[CreatedDate.autoCalendar.Date])- Max({<PSR_or_RMA_Transaction={'PSR'}>}[CreatedDate.autoCalendar.Date])),CaseNumber))<=1,1,0))
I can't check in editor without these fields,
with error you must have an underline or a character in red to help you,
you can too double click on each left ( to see if it ends on the right good one (in yellow)
- Mark as New
- Bookmark
- Subscribe
- Mute
- Subscribe to RSS Feed
- Permalink
- Report Inappropriate Content
Still showing the same error, Olivier.
I do not know how to attached an excel file. Please bear on the Raw field shown below. Hope you can use this.
| CaseNumber | CreatedDate.autoCalendar.Date | PSR_or_RMA_Transaction |
| 01347853 | 8/20/2018 | PSR |
| 01354776 | 8/30/2018 | PSR |
| 01311826 | 8/17/2018 | PSR |
| 01354726 | 8/22/2018 | PSR |
| 01342698 | 8/16/2018 | RMA |
| 01354548 | 8/22/2018 | RMA |
| 01311826 | 8/17/2018 | RMA |
| 01325278 | 8/31/2018 | RMA |
| 01338590 | 8/13/2018 | RMA |
| 01325266 | 8/27/2018 | RMA |
| 01354726 | 8/22/2018 | RMA |
| 01314571 | 8/28/2018 | RMA |
| 01337067 | 8/27/2018 | RMA |
| 01354776 | 8/31/2018 | RMA |
| 01347853 | 8/21/2018 | RMA |
| 01325278 | 8/31/2018 | PSR |
| 01325266 | 8/27/2018 | PSR |
| 01314571 | 8/28/2018 | PSR |
| 01337067 | 8/24/2018 | PSR |
| 01342698 | 8/13/2018 | PSR |
| 01354548 | 8/22/2018 | PSR |
Thank you!
- Mark as New
- Bookmark
- Subscribe
- Mute
- Subscribe to RSS Feed
- Permalink
- Report Inappropriate Content
Hi Olivier,
I think I have spotted it.
Sum(Total if(Aggr((Max({<PSR_or_RMA_Transaction={'RMA'}>}[CreatedDate.autoCalendar.Date])-Max({<PSR_or_RMA_Transaction={'PSR'}>}[CreatedDate.autoCalendar.Date])),CaseNumber)<=1,1,0))
Thank you so much!
- Mark as New
- Bookmark
- Subscribe
- Mute
- Subscribe to RSS Feed
- Permalink
- Report Inappropriate Content
Hello Olivier,
I have a follow up inquiry, hope you could provide assistance.
I want to create a combo chart (Bars and Line), here's what I have:
Dimension: Work Week
Measures:
Height of bar
Pickup Requests: Count({<PSR_or_RMA_Transaction={'PSR'}>}[CreatedDate.autoCalendar.Date])
Booking of RMAs: sum(total if(Aggr((max({<PSR_or_RMA_Transaction={'RMA'}>}[CreatedDate.autoCalendar.Date])-max({<PSR_or_RMA_Transaction={'PSR'}>}[CreatedDate.autoCalendar.Date])),CaseNumber)<=1,1,0))
Height of line
SLA
sum(Total if(Aggr((Max({<PSR_or_RMA_Transaction={'RMA'}>}[CreatedDate.autoCalendar.Date])-Max({<PSR_or_RMA_Transaction={'PSR'}>}[CreatedDate.autoCalendar.Date])),CaseNumber)<=1,1,0)) /
count({<PSR_or_RMA_Transaction={'PSR'}>}[CreatedDate.autoCalendar.Date])
Here's the chart will look like

Now here is my problem:
> As you can see the RMA Booking was not broken down per week it was reflecting the totals values each week instead, do you have an idea (expressions) on how to solve my problem?
> my SLA measures will be fixed once my it was solved
RMA Booking should be broken down as follows:
WW33 - 1
WW34 - 3
WW35 - 4
I have here the sample Table and Raw data
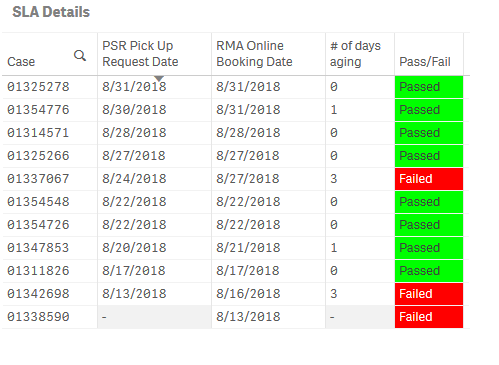
Sample straight table output
| Case | CreatedDate.autoCalendar.Week | PSR Pickup Request Date | RMA Online Booking Date | # of days aging | Pass/Fail |
| 01325278 | W35 | 8/31/2018 | 8/31/2018 | 0 | Passed |
| 01354776 | W35 | 8/30/2018 | 8/31/2018 | 1 | Passed |
| 01314571 | W35 | 8/28/2018 | 8/28/2018 | 0 | Passed |
| 01325266 | W35 | 8/27/2018 | 8/27/2018 | 0 | Passed |
| 01337067 | W34 | 8/24/2018 | 8/27/2018 | 3 | Failed |
| 01354726 | W34 | 8/22/2018 | 8/22/2018 | 0 | Passed |
| 01354548 | W34 | 8/22/2018 | 8/22/2018 | 0 | Passed |
| 01347853 | W34 | 8/20/2018 | 8/21/2018 | 1 | Passed |
| 01311826 | W33 | 8/17/2018 | 8/17/2018 | 0 | Passed |
| 01342698 | W33 | 8/13/2018 | 8/16/2018 | 3 | Failed |
| 01338590 | W33 | - | 8/13/2018 | - | Failed |
Sample Raw Data
| Case | Date | CreatedDate.autoCalendar.Week | PSR_or_RMA_Transaction |
| 01354776 | 8/30/2018 | W35 | PSR |
| 01354776 | 8/31/2018 | W35 | RMA |
| 01354726 | 8/22/2018 | W34 | PSR |
| 01354726 | 8/22/2018 | W34 | RMA |
| 01354548 | 8/22/2018 | W34 | RMA |
| 01354548 | 8/22/2018 | W34 | PSR |
| 01347853 | 8/20/2018 | W34 | PSR |
| 01347853 | 8/21/2018 | W34 | RMA |
| 01342698 | 8/16/2018 | W33 | RMA |
| 01342698 | 8/13/2018 | W33 | PSR |
| 01338590 | 8/13/2018 | W33 | RMA |
| 01337067 | 8/27/2018 | W35 | RMA |
| 01337067 | 8/24/2018 | W34 | PSR |
| 01325278 | 8/31/2018 | W35 | RMA |
| 01325278 | 8/31/2018 | W35 | PSR |
| 01325266 | 8/27/2018 | W35 | RMA |
| 01325266 | 8/27/2018 | W35 | PSR |
| 01314571 | 8/28/2018 | W35 | RMA |
| 01314571 | 8/28/2018 | W35 | PSR |
| 01311826 | 8/17/2018 | W33 | PSR |
| 01311826 | 8/17/2018 | W33 | RMA |
Thank you so much!
IC
- Mark as New
- Bookmark
- Subscribe
- Mute
- Subscribe to RSS Feed
- Permalink
- Report Inappropriate Content
if you change dimensions,
you must change it too in aggr !
and add Work Week in aggr formula
- Mark as New
- Bookmark
- Subscribe
- Mute
- Subscribe to RSS Feed
- Permalink
- Report Inappropriate Content
Hi Olivier,
I have tried that as well with below formula:
Dimension: Work Week
Measures:
Height of bar
Pickup Requests: Count({<PSR_or_RMA_Transaction={'PSR'}>}[CreatedDate.autoCalendar.Date])
Booking of RMAs: sum(total if(Aggr((max({<PSR_or_RMA_Transaction={'RMA'}>}[CreatedDate.autoCalendar.Date])-max({<PSR_or_RMA_Transaction={'PSR'}>}[CreatedDate.autoCalendar.Date])),[CreatedDate.autoCalendar.Week])<=1,1,0))
Height of line
SLA
sum(Total if(Aggr((Max({<PSR_or_RMA_Transaction={'RMA'}>}[CreatedDate.autoCalendar.Date])-Max({<PSR_or_RMA_Transaction={'PSR'}>}[CreatedDate.autoCalendar.Date])),[CreatedDate.autoCalendar.Week])<=1,1,0)) /
count({<PSR_or_RMA_Transaction={'PSR'}>}[CreatedDate.autoCalendar.Date])
Here's what I've got in my chart:

- Mark as New
- Bookmark
- Subscribe
- Mute
- Subscribe to RSS Feed
- Permalink
- Report Inappropriate Content
you need to add, not replace !
so aggr(................, week, case)
the
- « Previous Replies
-
- 1
- 2
- Next Replies »