Unlock a world of possibilities! Login now and discover the exclusive benefits awaiting you.
- Qlik Community
- :
- Forums
- :
- Analytics
- :
- Topics
- :
- App Development
- :
- Count no.of times one value is greater than other
- Subscribe to RSS Feed
- Mark Topic as New
- Mark Topic as Read
- Float this Topic for Current User
- Bookmark
- Subscribe
- Mute
- Printer Friendly Page
- Mark as New
- Bookmark
- Subscribe
- Mute
- Subscribe to RSS Feed
- Permalink
- Report Inappropriate Content
Count no.of times one value is greater than other
I want to count no.of times " Max({$<FactKey={4}>}xSale)*-1 " is greater than " Max({<Scenario>}ySale)*100 " using KPI with following formula:
Count(Aggr((Max({$<FactKey={4}>}xSale)*-1) > (Max({<Scenario>}ySale)*100),Country))
but the output is incorrect. What is wrong with this formula. Also i want that my count should not include any value where either of the above measures (Max({$<FactKey={4}>}xSale)*-1 or Max({<Scenario>}ySale)*100 )are null.
- « Previous Replies
-
- 1
- 2
- Next Replies »
- Mark as New
- Bookmark
- Subscribe
- Mute
- Subscribe to RSS Feed
- Permalink
- Report Inappropriate Content
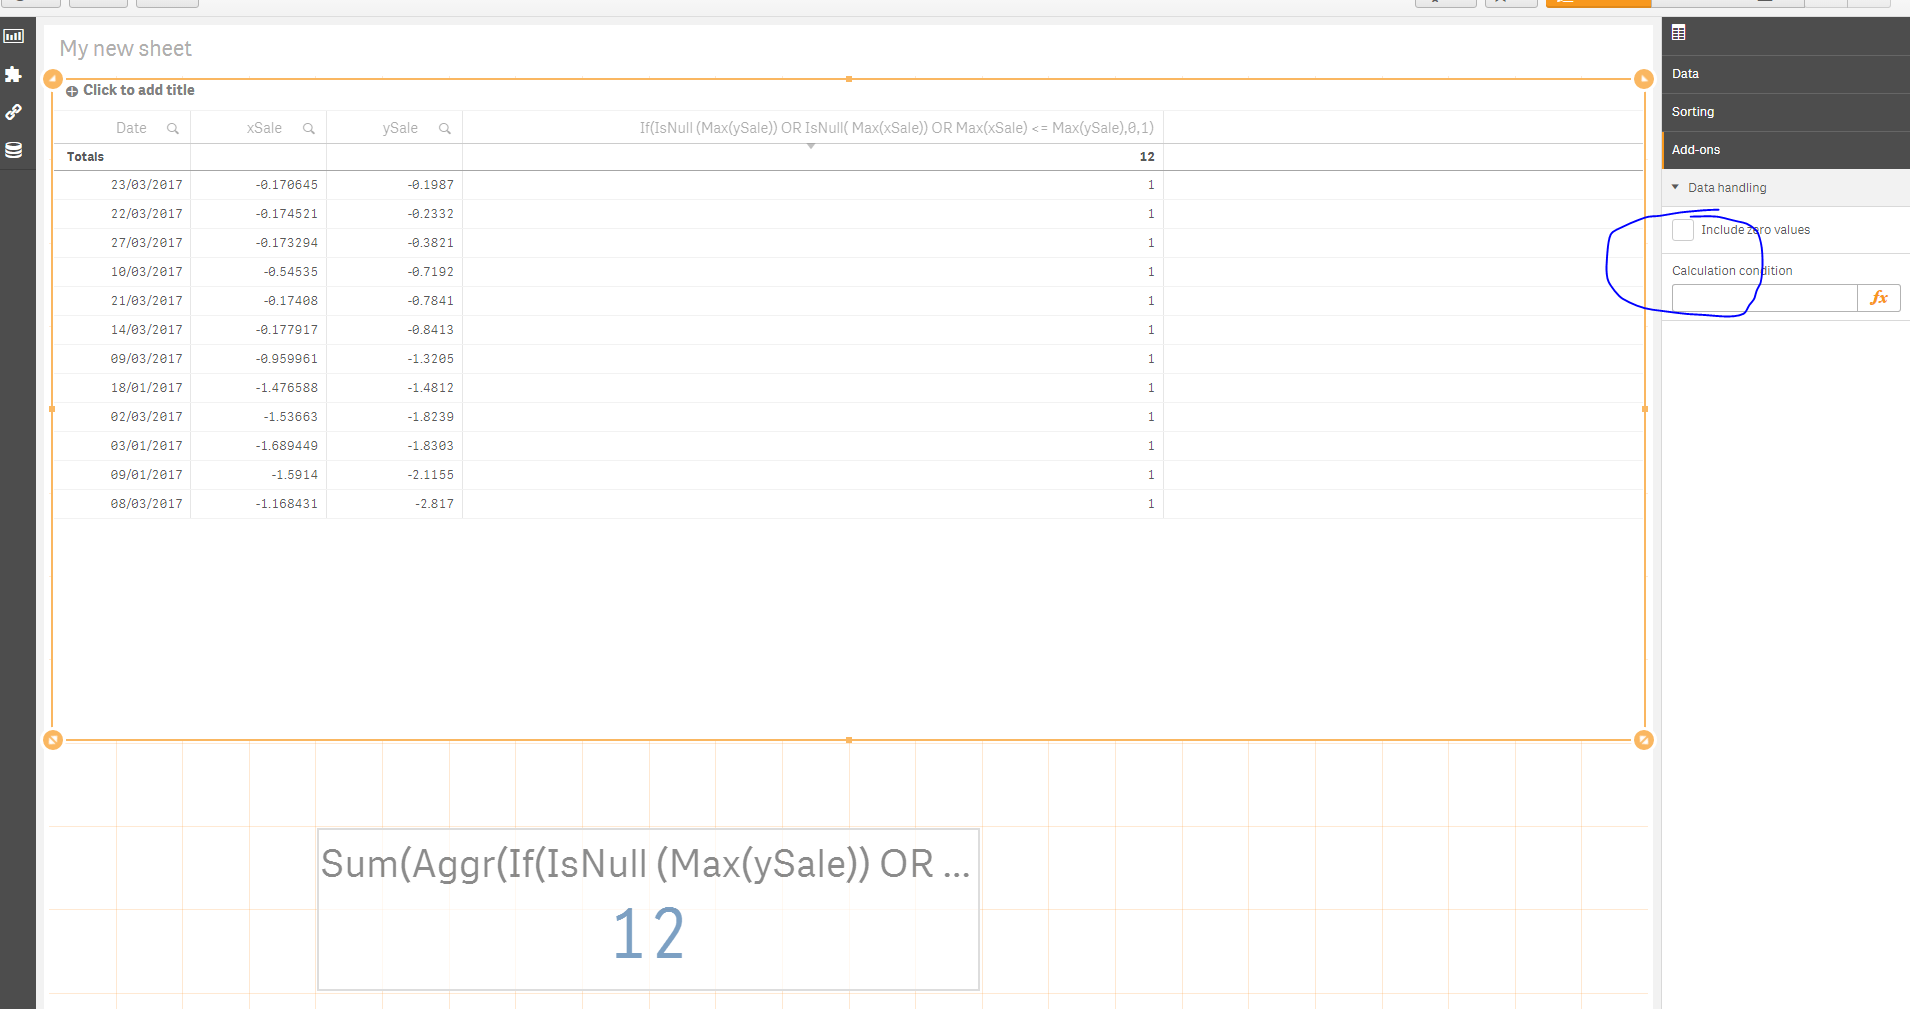
is there a way to show only those rows in table where the value is 1 but i dont want to show that column with 1,0 values ?
- Mark as New
- Bookmark
- Subscribe
- Mute
- Subscribe to RSS Feed
- Permalink
- Report Inappropriate Content
Uncheck 'Include Zero Value' under Add-ons -> Data handling
- Mark as New
- Bookmark
- Subscribe
- Mute
- Subscribe to RSS Feed
- Permalink
- Report Inappropriate Content
i dont want that calculated column(last) also with 1,0 values. if i remove that column everything will come.Thats what i told in my previous comment
Basically i want to show only those rows where xsale > ysale and either of them should not be null,for that i have created that column but i dont want to show that column
- Mark as New
- Bookmark
- Subscribe
- Mute
- Subscribe to RSS Feed
- Permalink
- Report Inappropriate Content
Will check back in a bit
- Mark as New
- Bookmark
- Subscribe
- Mute
- Subscribe to RSS Feed
- Permalink
- Report Inappropriate Content
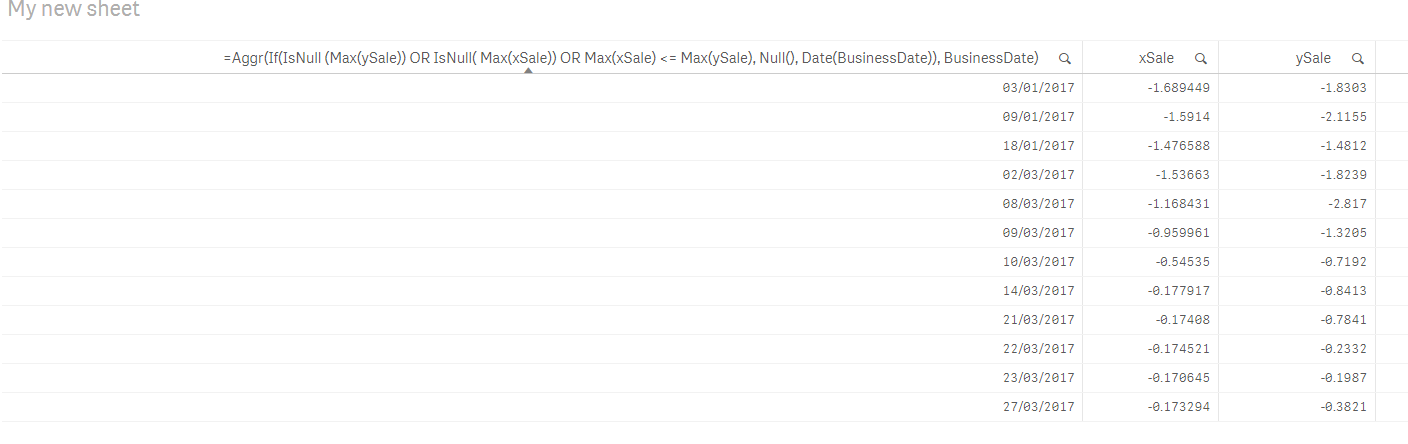
Try with a calculated dimension
Dimension
=Aggr(If(IsNull (Max(ySale)) OR IsNull( Max(xSale)) OR Max(xSale) <= Max(ySale), Null(), Date(BusinessDate)), BusinessDate)
xSale
ySale
- Mark as New
- Bookmark
- Subscribe
- Mute
- Subscribe to RSS Feed
- Permalink
- Report Inappropriate Content
hi sunny,
i want help with one more issue. Suppose i select a date from BusinessDate filter, i want all the calculations (both for table and KPI )to be done for past 2 months from the date i select from filter.
Suppose i select 29/03/2017 so the kpi should should be calculated from 29/01/2017 to 29/03/2017
- Mark as New
- Bookmark
- Subscribe
- Mute
- Subscribe to RSS Feed
- Permalink
- Report Inappropriate Content
For some reason it doesn't seem to be working without an expression in the chart, but KPI seems to work with this
Sum({<BusinessDate = {"$(='>=' & Date(AddMonths(Max(BusinessDate), -2)) & '<=' & Date(Max(BusinessDate)))"}>}Aggr(If(IsNull (Max({<BusinessDate = {"$(='>=' & Date(AddMonths(Max(BusinessDate), -2)) & '<=' & Date(Max(BusinessDate)))"}>}ySale)) OR IsNull( Max({<BusinessDate = {"$(='>=' & Date(AddMonths(Max(BusinessDate), -2)) & '<=' & Date(Max(BusinessDate)))"}>}xSale)) OR Max({<BusinessDate = {"$(='>=' & Date(AddMonths(Max(BusinessDate), -2)) & '<=' & Date(Max(BusinessDate)))"}>}xSale) <= Max({<BusinessDate = {"$(='>=' & Date(AddMonths(Max(BusinessDate), -2)) & '<=' & Date(Max(BusinessDate)))"}>}ySale),0,1),BusinessDate, xSale, ySale))
- « Previous Replies
-
- 1
- 2
- Next Replies »