Unlock a world of possibilities! Login now and discover the exclusive benefits awaiting you.
- Qlik Community
- :
- Forums
- :
- Analytics & AI
- :
- Products & Topics
- :
- App Development
- :
- Creating Cumulative Data Table for Specific Graph
- Subscribe to RSS Feed
- Mark Topic as New
- Mark Topic as Read
- Float this Topic for Current User
- Bookmark
- Subscribe
- Mute
- Printer Friendly Page
- Mark as New
- Bookmark
- Subscribe
- Mute
- Subscribe to RSS Feed
- Permalink
- Report Inappropriate Content
Creating Cumulative Data Table for Specific Graph
Hello all:
I have a graph that needs to be created but before the graph can be created the underlying data must be manipulated in a specific order. I have a table with projects id (Col A) , NPV (Col B), Investment (Col C), Ratio (NPV/Invest - Col D), Cumulative Invest (Col E), Cumulative NPV (Col G). Columns F & H are just in the below file for reference as to how I need the formulas to work for columns D & E. Columns D, E, & G are calculated columns and the only information I'm given (assume) are Project ID, NPV, and Investment. The order that the data needs to be manipulated is:
| 1. Create ratio by taking column B / column C = column D |
| 2. Sort by column D descending |
| 3. Create column E = cumulative Investment (Essentially starting with row 1 and adds each subsequent row (i.e. row 1 = Invest1, row 2 = Invest1+Invest2.....) |
| 4. Create column G = cumulative NPV (Essentially starting with row 1 and adds each subsequent row (i.e. row 1 = NPV1, row 2 = NPV1+NPV2.....) |
| 5. Then create the graph (see below) |
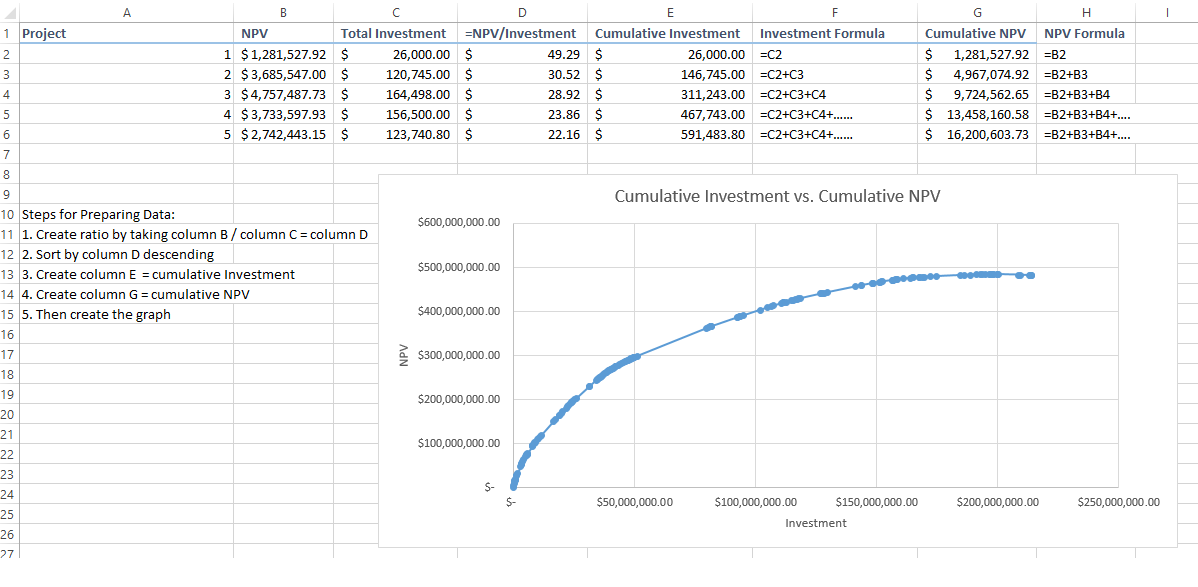
The main issue I'm running into is the actions that need to be taken and the expression for creating the cumulative columns where row2 is equal to ColB,Row1 + ColB,Row2 and only after the data has been "ranked"/sorted by column D. Any thoughts or suggestions would be appreciated.