Unlock a world of possibilities! Login now and discover the exclusive benefits awaiting you.
Announcements
Now accepting applications for the Qlik Luminary and Partner Ambassador Programs: Apply by July 6!
- Qlik Community
- :
- Forums
- :
- Analytics & AI
- :
- Products & Topics
- :
- App Development
- :
- Cumalitve Chart For Multiple Years
Options
- Subscribe to RSS Feed
- Mark Topic as New
- Mark Topic as Read
- Float this Topic for Current User
- Bookmark
- Subscribe
- Mute
- Printer Friendly Page
Turn on suggestions
Auto-suggest helps you quickly narrow down your search results by suggesting possible matches as you type.
Showing results for
Not applicable
2016-07-26
02:37 PM
- Mark as New
- Bookmark
- Subscribe
- Mute
- Subscribe to RSS Feed
- Permalink
- Report Inappropriate Content
Cumalitve Chart For Multiple Years
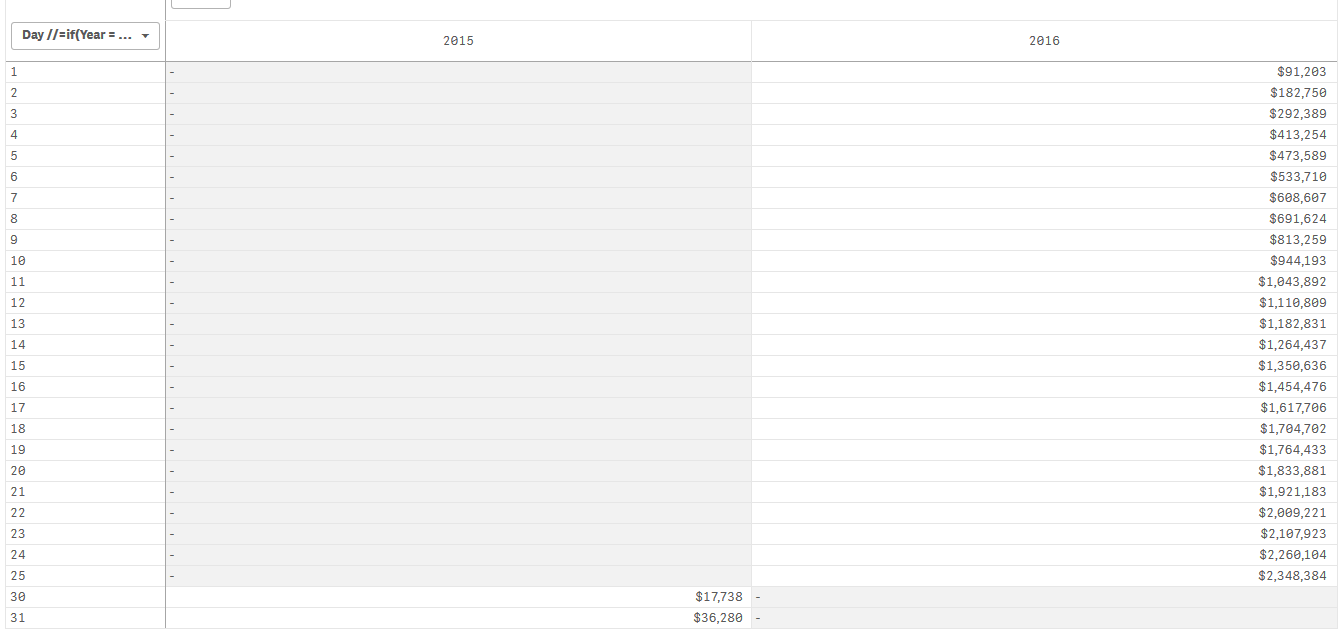
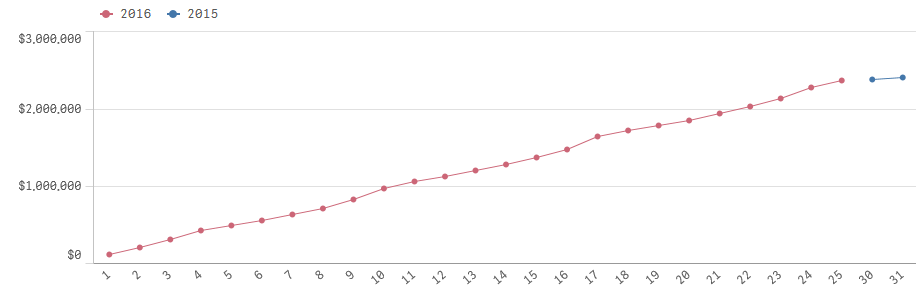
The views shown are a pivot and line chart for the same expression and dimension.
Measure : Rangesum(above(TOTAL(SUM ({<Month = {$(=Month(Today()))} , MonthYear=, WeekDay=>} [TIPS Amount])), 0,rowno(TOTAL)))
Dimension : Day and Year
I dont know why for 2015 in pivot shows 17K and 36K but in the line starts from amount that not true.
Any suggestions?
959 Views
0 Replies