Unlock a world of possibilities! Login now and discover the exclusive benefits awaiting you.
- Qlik Community
- :
- Forums
- :
- Analytics & AI
- :
- Products & Topics
- :
- App Development
- :
- Re: Cumulative sum in qliksense Bar Chart with two...
- Subscribe to RSS Feed
- Mark Topic as New
- Mark Topic as Read
- Float this Topic for Current User
- Bookmark
- Subscribe
- Mute
- Printer Friendly Page
- Mark as New
- Bookmark
- Subscribe
- Mute
- Subscribe to RSS Feed
- Permalink
- Report Inappropriate Content
Cumulative sum in qliksense Bar Chart with two dimensions
Hello Guys,
Could you please help me how to calculate cumulative sum in qlik sense bar chart with 2 Dimensions.
This expression only works for 1 dimension:
rangesum( above( sum([Expression1]),0,rowno()))
I have data like below table where MonthName and Industry are dimensions in chart and Amount is Measure.
| MonthName | Industry | Amount | Year |
| Jan | AA | 100 | 2015 |
| Feb | BB | 200 | 2015 |
| Mar | CC | 300 | 2015 |
| Apr | DD | 400 | 2015 |
| May | EE | 500 | 2015 |
| Jun | FF | 600 | 2015 |
| Jul | GG | 700 | 2015 |
| Aug | HH | 800 | 2015 |
| Sep | II | 900 | 2015 |
| Oct | JJ | 1000 | 2015 |
| Nov | KK | 1100 | 2015 |
| Dec | LL | 1200 | 2015 |
Your help is really appreciated.
Thanks,
Ram Krishna
- Tags:
- cumulative sum
- « Previous Replies
-
- 1
- 2
- Next Replies »
Accepted Solutions
- Mark as New
- Bookmark
- Subscribe
- Mute
- Subscribe to RSS Feed
- Permalink
- Report Inappropriate Content
Here you go.... You will need to do some script manipulation to get this to work
- Mark as New
- Bookmark
- Subscribe
- Mute
- Subscribe to RSS Feed
- Permalink
- Report Inappropriate Content
May be this:
RangeSum(Above(TOTAL Sum([Expression1]), 0, RowNo(TOTAL)))
- Mark as New
- Bookmark
- Subscribe
- Mute
- Subscribe to RSS Feed
- Permalink
- Report Inappropriate Content
Hi Sunny,
This only works with one dimension not with 2 dimension in chart.
Thanks,
Ram Krishna
- Mark as New
- Bookmark
- Subscribe
- Mute
- Subscribe to RSS Feed
- Permalink
- Report Inappropriate Content
I don't see a reason why it won't work.... Do you have a sample you can share your qvf where this is not working?
- Mark as New
- Bookmark
- Subscribe
- Mute
- Subscribe to RSS Feed
- Permalink
- Report Inappropriate Content
Hi Sunny,
I have attached a qvf file for you reference. You will see that above code works with only 1 dimension not with 2 dimension.
I am aware of above code and already worked with single dimension in many projects, Issue is when you add second dimensions in x-axis it will not work.
Thanks,
Ram Krishna
- Mark as New
- Bookmark
- Subscribe
- Mute
- Subscribe to RSS Feed
- Permalink
- Report Inappropriate Content
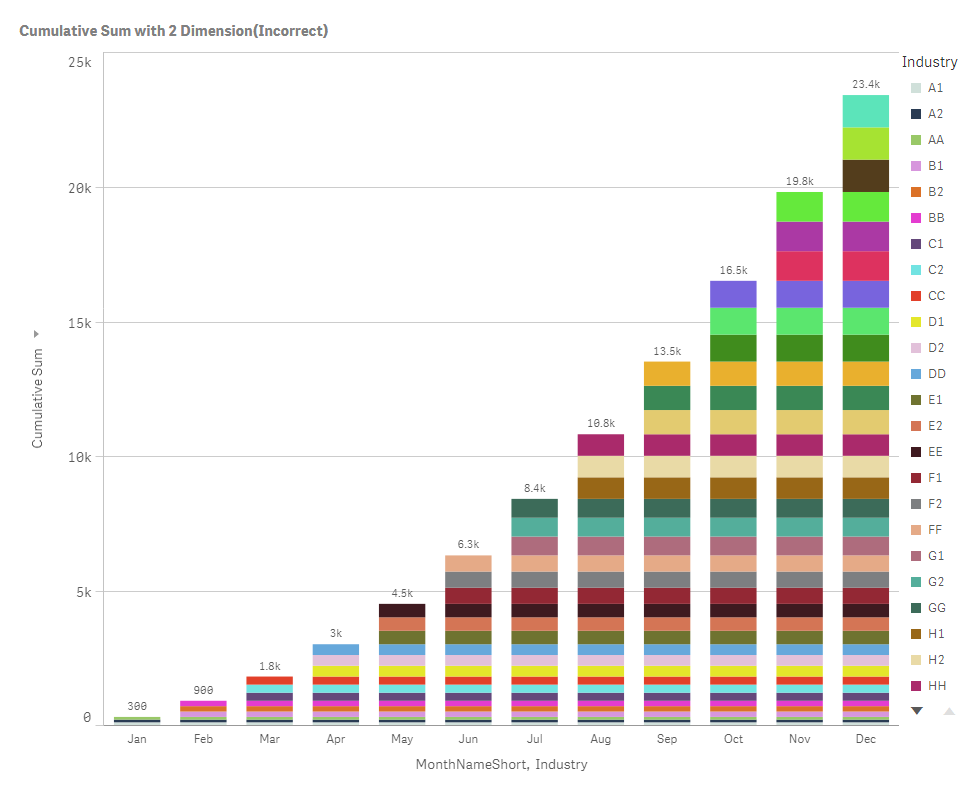
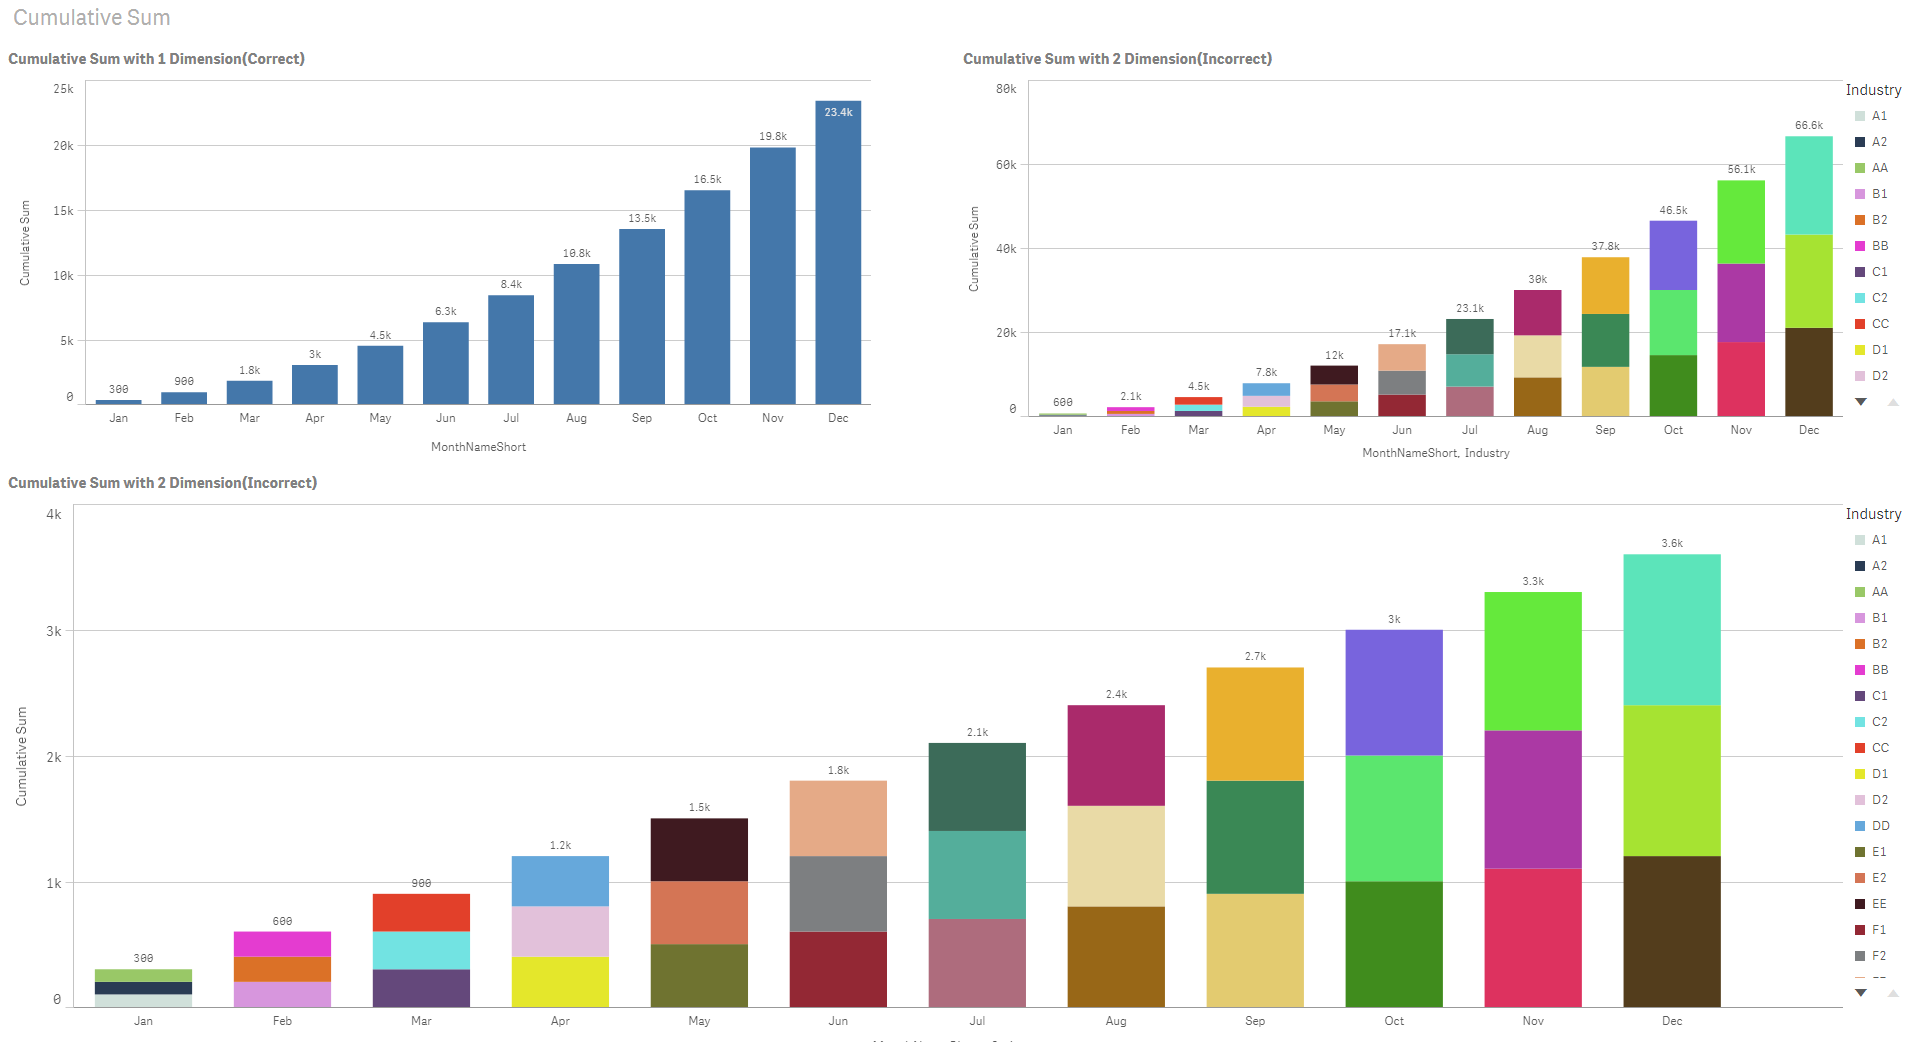
Are you looking for one of these output?
- Mark as New
- Bookmark
- Subscribe
- Mute
- Subscribe to RSS Feed
- Permalink
- Report Inappropriate Content
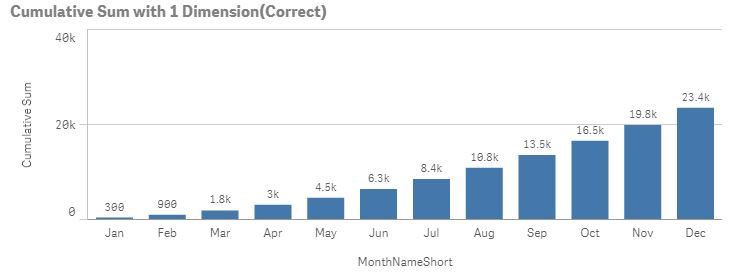
No, Value should be like same as Cumulative Sum with 1 dimension(By Month).
- Mark as New
- Bookmark
- Subscribe
- Mute
- Subscribe to RSS Feed
- Permalink
- Report Inappropriate Content
You above value is showing the sum of the different industry by Month, not the cumulative sum.
- Mark as New
- Bookmark
- Subscribe
- Mute
- Subscribe to RSS Feed
- Permalink
- Report Inappropriate Content
I am not full understanding what you are after? Each month you have different industry?? I guess you are after the totals with 1 dimension?? But I am trying to understand how it would show up in two dimensions?
- Mark as New
- Bookmark
- Subscribe
- Mute
- Subscribe to RSS Feed
- Permalink
- Report Inappropriate Content
Actually i want cumulative sum By Industry and By Month in single graph(So taken 2 dimensions Industry and Month)
- « Previous Replies
-
- 1
- 2
- Next Replies »