Unlock a world of possibilities! Login now and discover the exclusive benefits awaiting you.
- Qlik Community
- :
- Forums
- :
- Analytics & AI
- :
- Products & Topics
- :
- App Development
- :
- Re: Date field formatting for chart dimensions
- Subscribe to RSS Feed
- Mark Topic as New
- Mark Topic as Read
- Float this Topic for Current User
- Bookmark
- Subscribe
- Mute
- Printer Friendly Page
- Mark as New
- Bookmark
- Subscribe
- Mute
- Subscribe to RSS Feed
- Permalink
- Report Inappropriate Content
Date field formatting for chart dimensions
Hi everyone,
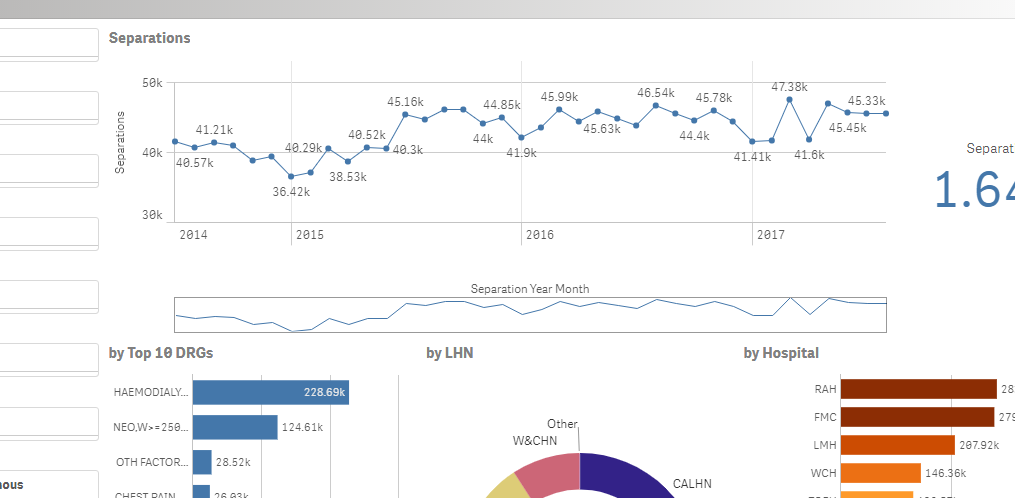
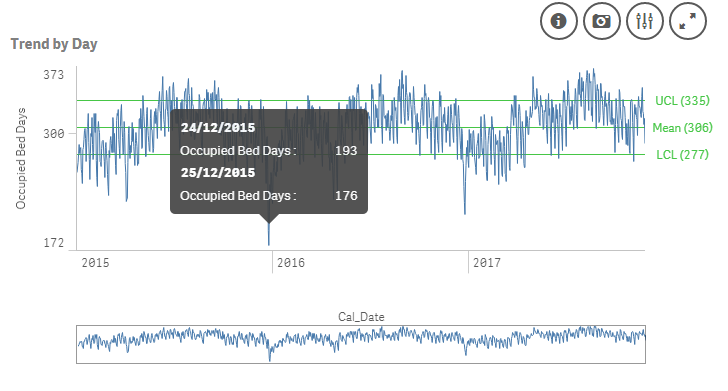
I added a field 'Cal_Date' to my Master dimensions list. I then created a line chart using this as the X-axis dimension. The date fields are loaded in the typical date integer format (eg "42938"). When first created, the line chart by default shows 3 years of data zoomed-out, with Y-axis labels for each year showing as '1/1/2015', '1/1/2016', '1/1/2017'. This is what I want - it looks very nice.
However, when I hover over a data-point, the 'Cal_Date' field shows in the Integer format again (eg. 42932) rather than in a date format. There appears to be no way to ''number format' the dimension field, either in Master dimensions or in the Line Chart object. (Frustrating as Qiksense has recognised this as a date field and has formatted the X-Axis labels as dates)
I then tried editing the formula in Master Dimension to date(Cal_Date) which corrects the issue of dates showing as an integer. However, it then forces the chart to zoom into about 10 days worth of dates, rather than showing me the 3 years of data in its entirety. Additionally, the resize view window feature of the line chart becomes disabled.
Version: Qliksense June 2017 (I'm currently installing November 2017)
Is there a workaround - or a proposed fix for later/upcoming Qliksense versions?
Any help is appreciated - cheers, Will.
Accepted Solutions
- Mark as New
- Bookmark
- Subscribe
- Mute
- Subscribe to RSS Feed
- Permalink
- Report Inappropriate Content
Ok, now please delete the Master Dimension you've and use the field you've created directly. Not just don't use it but delete it
I know it sound weird but I spent a whole day trying to sort it out when building this:
- Mark as New
- Bookmark
- Subscribe
- Mute
- Subscribe to RSS Feed
- Permalink
- Report Inappropriate Content
Hi William,
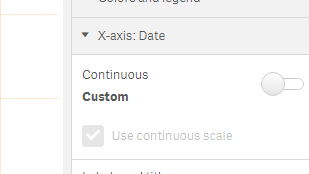
On the axis where the Date is, remove Auto for Continuous and make sure the box for Use Continuous Scale is ticked
Please let me know how it goes,
If this doesn't work, you may need to revisit the conversion to a Date format. If possible please add screenshots or even better the qvf for for that you may need to start another post... well I haven't been able to attach a file to a reply, only to the original post
Cheers,
Luis
- Mark as New
- Bookmark
- Subscribe
- Mute
- Subscribe to RSS Feed
- Permalink
- Report Inappropriate Content
Hi Luis,
Thanks for your reply. I meant to write X-Axis dimension in the first email.
(1) Here is a screenshot of how the chart initially appears. This is what I want.
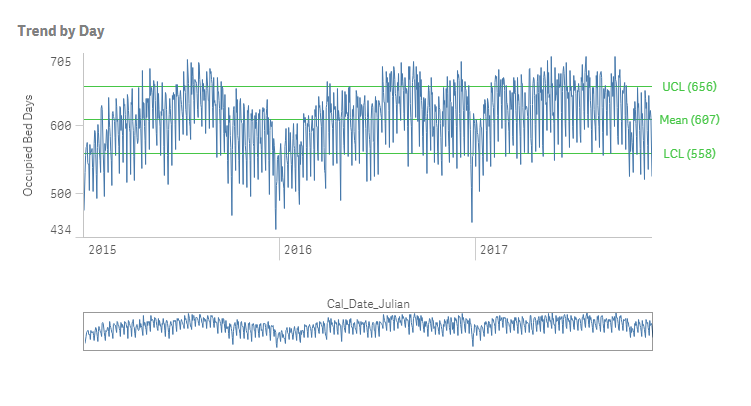
(2) Here is the hover over behaviour - showing integers instead of dates.
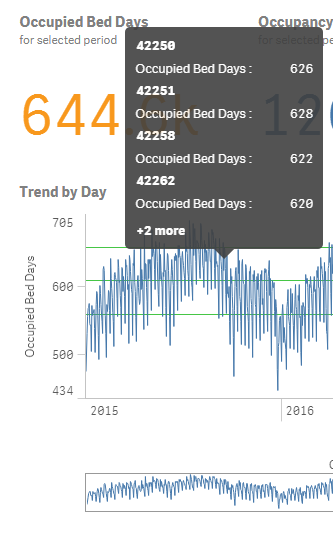
(3) Then when I change the default date field to Date(Cal_Date) in the load script I get the following. This doesn't allow me to zoom out again.
I have already tried toggling the X-Axis Continuous option from Auto to Custom, with no change to the chart. The only way I could go back and recreate my original chart was by using another date field 'Cal_Date_Juilian'. It seems like once the original Date field was "touched" by Qliksense, something in its logic has decided to interpret it differently thereafter.
Unfortunately, I can't post a qvf unless I create a dummy dataset to demonstrate. Happy to do if needed, however hopefully the pictures give you an idea.
Will
- Mark as New
- Bookmark
- Subscribe
- Mute
- Subscribe to RSS Feed
- Permalink
- Report Inappropriate Content
Hi,
Once you changed it to Custom, was the Use Continuous Scale box ticked?
- Mark as New
- Bookmark
- Subscribe
- Mute
- Subscribe to RSS Feed
- Permalink
- Report Inappropriate Content
Yes, but it is greyed out...
- Mark as New
- Bookmark
- Subscribe
- Mute
- Subscribe to RSS Feed
- Permalink
- Report Inappropriate Content
Ok, now please delete the Master Dimension you've and use the field you've created directly. Not just don't use it but delete it
I know it sound weird but I spent a whole day trying to sort it out when building this:
- Mark as New
- Bookmark
- Subscribe
- Mute
- Subscribe to RSS Feed
- Permalink
- Report Inappropriate Content
OK thanks, Luis - you are a legend!
So in summary, there is a bug using a Date field as a Master Dimension - but this works if you use it as
a chart dimension.
- Mark as New
- Bookmark
- Subscribe
- Mute
- Subscribe to RSS Feed
- Permalink
- Report Inappropriate Content
PS good to see another health sector example!
- Mark as New
- Bookmark
- Subscribe
- Mute
- Subscribe to RSS Feed
- Permalink
- Report Inappropriate Content
Cheers,
It's freaky isn't it. If you just recreate that Master Dimension you can see how the whole chart becomes time unaware.
I also have June 17... maybe you'll get it sorted in next version,
Cheers,
Luis
- Mark as New
- Bookmark
- Subscribe
- Mute
- Subscribe to RSS Feed
- Permalink
- Report Inappropriate Content
PS does anyone know if this has been logged as a bug in Qliksense (June 2017) to get fixed?