Unlock a world of possibilities! Login now and discover the exclusive benefits awaiting you.
- Qlik Community
- :
- Forums
- :
- Analytics & AI
- :
- Products & Topics
- :
- App Development
- :
- Dimensions Limitation
- Subscribe to RSS Feed
- Mark Topic as New
- Mark Topic as Read
- Float this Topic for Current User
- Bookmark
- Subscribe
- Mute
- Printer Friendly Page
- Mark as New
- Bookmark
- Subscribe
- Mute
- Subscribe to RSS Feed
- Permalink
- Report Inappropriate Content
Dimensions Limitation
Hi Team,
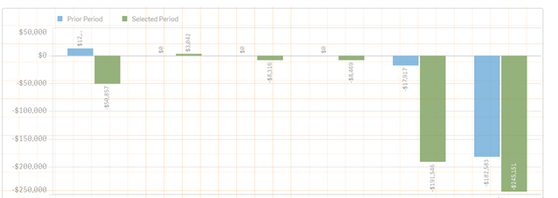
We are using dimension limitation in combo chart and limiting the below visual to Top 7.
Data has both +ve and -ve values and zeros in the prior period(blue bar). It is displaying only 3 values instead of 7 in the screenshot attached. Could you please clarify why the behavior is different?

Thanks,
Madhu
Accepted Solutions
- Mark as New
- Bookmark
- Subscribe
- Mute
- Subscribe to RSS Feed
- Permalink
- Report Inappropriate Content
I found a solution. I was excluding zero values (when prior and selected period is zero) in the grid. So when i applied limitation it was considering them as well to derive Top 7. Hope this helps in case in anyone see such issue
