Unlock a world of possibilities! Login now and discover the exclusive benefits awaiting you.

Announcements
Want to see what's currently in public preview? We've pulled it all together in one place. Check it out here
- Qlik Community
- :
- Forums
- :
- Analytics & AI
- :
- Products & Topics
- :
- App Development
- :
- Dynamic axis Min/Max range in Qliksense combo char...
Options
- Subscribe to RSS Feed
- Mark Topic as New
- Mark Topic as Read
- Float this Topic for Current User
- Bookmark
- Subscribe
- Mute
- Printer Friendly Page
Turn on suggestions
Auto-suggest helps you quickly narrow down your search results by suggesting possible matches as you type.
Showing results for

 revathy_murugai
Contributor
2021-09-20
01:30 AM
- Mark as New
- Bookmark
- Subscribe
- Mute
- Subscribe to RSS Feed
- Permalink
- Report Inappropriate Content
Dynamic axis Min/Max range in Qliksense combo chart
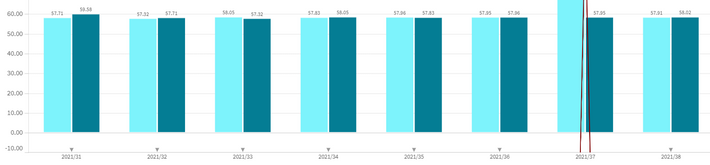
I need to show the Y axis range from the minimum value of my chart and its should be dynamic.
For Ex(minimum 57 or 56) the Y axis range should start from this.
thanks in advance.
3,257 Views
1 Reply

 lironbaram
Partner - Master III
2021-09-20
02:30 AM
- Mark as New
- Bookmark
- Subscribe
- Mute
- Subscribe to RSS Feed
- Permalink
- Report Inappropriate Content
Hi,
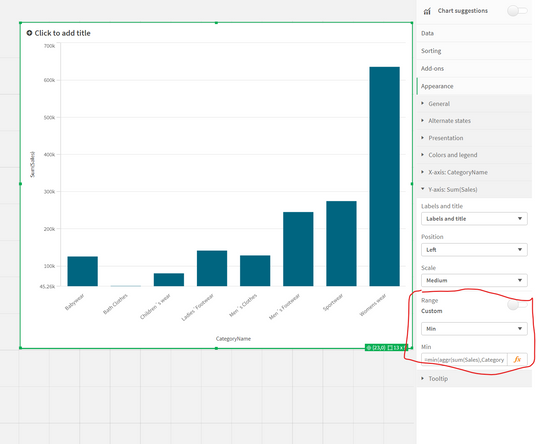
In the Y-axis settings, you can change the range setting from Auto to Custom.
Then you can use this expression for calculating the minimum value :
min(aggr(Sum(Sales),YearMonth))
* Please note you'll need to replace the names of the fields with your real ones.