Unlock a world of possibilities! Login now and discover the exclusive benefits awaiting you.

- Qlik Community
- :
- Forums
- :
- Analytics & AI
- :
- Products & Topics
- :
- App Development
- :
- Dynamic calculations using Date filters
- Subscribe to RSS Feed
- Mark Topic as New
- Mark Topic as Read
- Float this Topic for Current User
- Bookmark
- Subscribe
- Mute
- Printer Friendly Page

- Mark as New
- Bookmark
- Subscribe
- Mute
- Subscribe to RSS Feed
- Permalink
- Report Inappropriate Content
Dynamic calculations using Date filters
Hi friends,
I need some guidance on how to get change metrics from below data set.

Scenario: In the data set, We store Projects (ID) with its current week's phase (Discovery, Alpha,Beta,Live and Backlog) into Database. Project phases may change each week from one to another. I want to calculate this change and show it on Dashboard as below by comparing current vs previous week. I can select any 2 weeks from data using 2 filter pane (Island table)
Expected Results
New Projects= 2
Project Moved = 2
Project Failed = 2
Definition:
New - New projects added this week (e.g. 7 & 😎
Moved - Projects moved from one phase to another from previous week (e.g. 1 & 5)
Failed - Projects which are in Success status in previous week but failed into current week ( e.g. 3 & 4)
I was able to calculate the New metric using below formula but facing issues while calculating Moved & Failed metrics
vPrev_Week =If(GetFieldSelection([Prev Period])) // Filter Pane 1
vCurr_Week =If(GetFieldSelection([Current Period])) // Filter Pane 2
New = Count({<TIME ={"$(vPrev_Week )"} > + <TIME ={"$(vCurr_Week )"}> } Distinct ID) - Count({<TIME={"$(vPrev_Week )"}>}Distinct ID)
Moved = ?
Failed = ?
Any pointers/help will be highly appreciated
Cheers,
Kev

 MK9885
- Mark as New
- Bookmark
- Subscribe
- Mute
- Subscribe to RSS Feed
- Permalink
- Report Inappropriate Content
Can you please provide a sample XL data with expected results?
- Mark as New
- Bookmark
- Subscribe
- Mute
- Subscribe to RSS Feed
- Permalink
- Report Inappropriate Content
Thanks for your response.
Source Data (Sample):
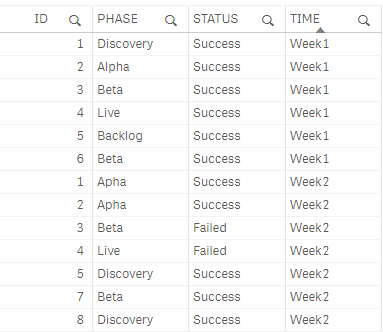
Expected Results:
New Projects= 2
Project Moved = 2
Project Failed = 2
Cheers,
Kev