Unlock a world of possibilities! Login now and discover the exclusive benefits awaiting you.
- Qlik Community
- :
- Forums
- :
- Analytics & AI
- :
- Products & Topics
- :
- App Development
- :
- Dynamic chart columns
- Subscribe to RSS Feed
- Mark Topic as New
- Mark Topic as Read
- Float this Topic for Current User
- Bookmark
- Subscribe
- Mute
- Printer Friendly Page
- Mark as New
- Bookmark
- Subscribe
- Mute
- Subscribe to RSS Feed
- Permalink
- Report Inappropriate Content
Dynamic chart columns
I am trying to create a dynamic chart where the headings Months/Years would change depending on what value is selected. I am able to do this by hardcoding but would prefer if I can make this dynamic so the user can go back to previous years. Currently i have the below but i dont know how i could make it dynamic based off field selection.

Currently im just hard coding the year such as below.
=If(NewMonths like '*21*', MonthName(NewMonths))
The field i would like to drive the headers has dates in MMM-YY so May-22 for example. This is why I was using a like statement originally. Is there a way to make it so if Feb-16 was selected the columns would change to year 2016 and the values for that year. Any help or link to material which would aid would be greatly appreciated.
Accepted Solutions
- Mark as New
- Bookmark
- Subscribe
- Mute
- Subscribe to RSS Feed
- Permalink
- Report Inappropriate Content
Hello,
Perhaps you can try the following approach:
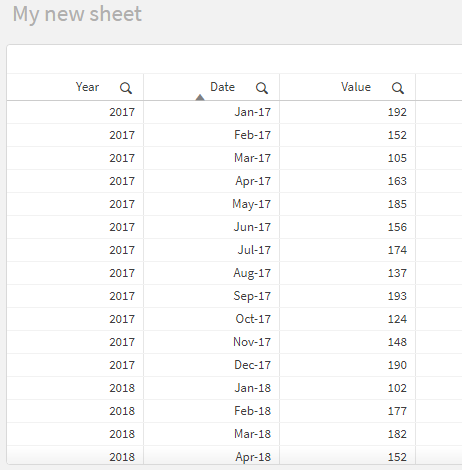
1. I would recommend to create another calculated field Year(Date) as Date in Data load editor script
2. Therefore the final dataset is:
3. For the Pivot char (That I assume you have, based on the screenshot shared), I have used the following expression under "Data > Column"
=If(WildMatch(Date, $(='''*' & Right(Replace(GetFieldSelections(Year), ', 20', '*'', ''*'), Len(Replace(GetFieldSelections(Year), ', 20', '''*, ''*')) - 2) & '*''')), MonthName(Date))
Allow me to elaborate in detail to what exactly this expression does:
- GetFieldSelections(Year) will return the currently selected values for the field Year
- For example if you select 2017, 2018, 2019 the output will be " 2017, 2018, 2019"
- The rest of the expression converts the value 2017, 2018, 2019 to '*17*','*18*','*19*'
- This value is then used within the If statement to check if the date falls within the selected year, hence return the MonthName(Date) as you have, otherwise, return nothing
The outcome is this:
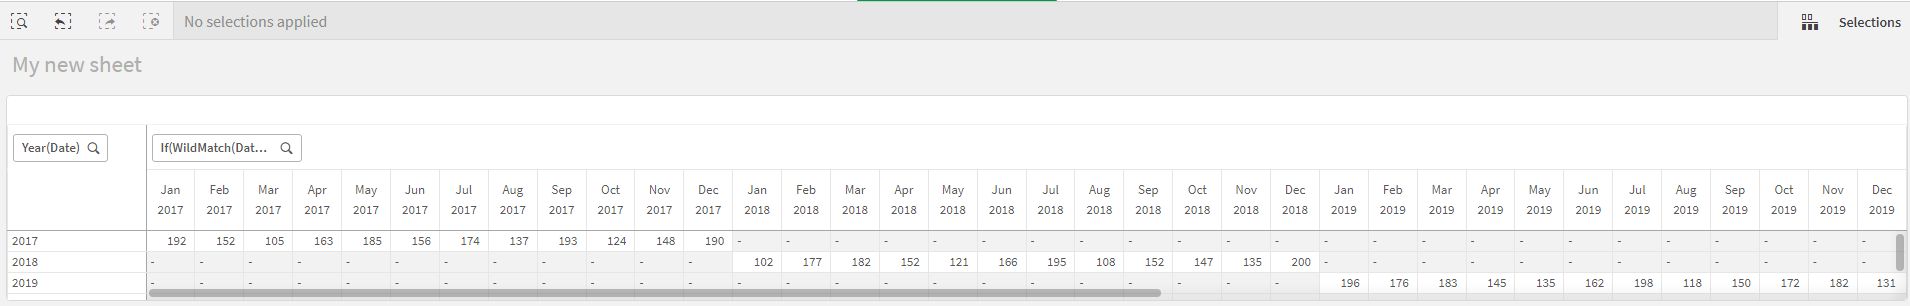
Observation:
- If a year value is not selected the expression returns '**', which means all the values. Hence you can see all the values in the chart
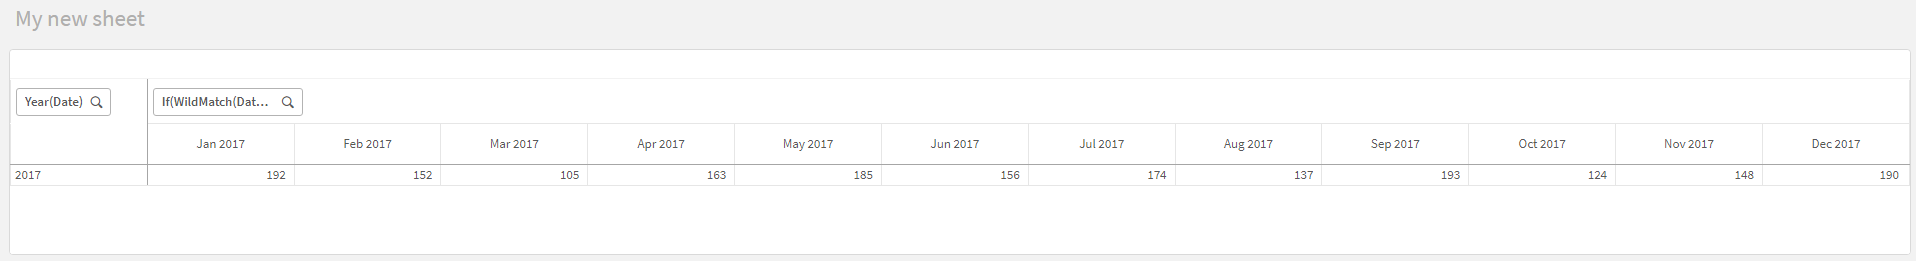
- If one year is selected, you can only see values for the dates within that year
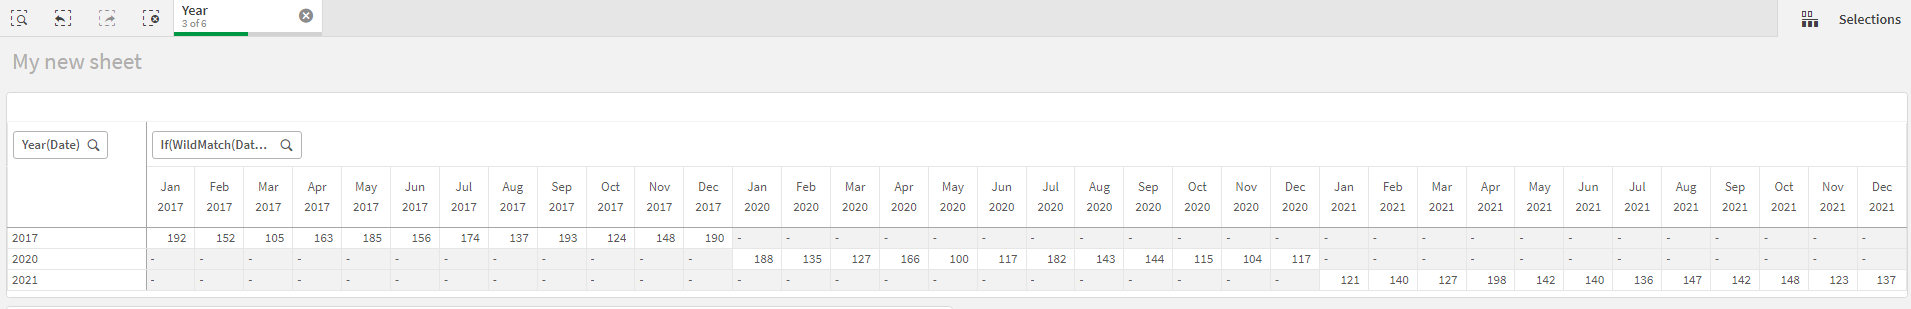
- If multiple years are selected, you can only see values for the dates that fall within the selected years
You can get the logic behind this idea and modify it according to your needs!
I hope that this information was helpful. In case I have misunderstood the use case scenario, please elaborate in details by providing additional information. However, if it has helped you resolve the issue, addressed your concerns or at least pointed you in the right direction, please mark it as Accepted Solution to give further visibility to other community members.
- Mark as New
- Bookmark
- Subscribe
- Mute
- Subscribe to RSS Feed
- Permalink
- Report Inappropriate Content
Hello,
Perhaps you can try the following approach:
1. I would recommend to create another calculated field Year(Date) as Date in Data load editor script
2. Therefore the final dataset is:
3. For the Pivot char (That I assume you have, based on the screenshot shared), I have used the following expression under "Data > Column"
=If(WildMatch(Date, $(='''*' & Right(Replace(GetFieldSelections(Year), ', 20', '*'', ''*'), Len(Replace(GetFieldSelections(Year), ', 20', '''*, ''*')) - 2) & '*''')), MonthName(Date))
Allow me to elaborate in detail to what exactly this expression does:
- GetFieldSelections(Year) will return the currently selected values for the field Year
- For example if you select 2017, 2018, 2019 the output will be " 2017, 2018, 2019"
- The rest of the expression converts the value 2017, 2018, 2019 to '*17*','*18*','*19*'
- This value is then used within the If statement to check if the date falls within the selected year, hence return the MonthName(Date) as you have, otherwise, return nothing
The outcome is this:
Observation:
- If a year value is not selected the expression returns '**', which means all the values. Hence you can see all the values in the chart
- If one year is selected, you can only see values for the dates within that year
- If multiple years are selected, you can only see values for the dates that fall within the selected years
You can get the logic behind this idea and modify it according to your needs!
I hope that this information was helpful. In case I have misunderstood the use case scenario, please elaborate in details by providing additional information. However, if it has helped you resolve the issue, addressed your concerns or at least pointed you in the right direction, please mark it as Accepted Solution to give further visibility to other community members.
- Mark as New
- Bookmark
- Subscribe
- Mute
- Subscribe to RSS Feed
- Permalink
- Report Inappropriate Content
Thank you so much, This is basically working perfectly for me bar one issue i am having.
I seem to be struggling to create the field which can then be read in the expression. I tried using the year from the auto calendar but since data is always building on top of previous months data it brings in old data. Going back on creating the field I am trying to use the current logic below but it doesn't seem to allow me to use it in the expression or show up as a field i have created. Any idea why this may be.
tmpData:
CrossTable(month,value,9)
LOAD *
FROM [lib://Qlik Uploads v1 (bsci_obrid10)/SIOP/CBP_Raw_Data.xlsx]
(ooxml, embedded labels, table is Sheet1);
Final:
load
"Sort Sequence",
Cycle,
"Production Unit",
Division,
"Product Platform",
"Product Family",
"Manufacturing Product Group",
"Production Line",
"Data Set",
date(num#(purgeChar(month,'"'),'00000')) as NewMonths,
value
resident tmpData;
drop table tmpData;
Load Year(NewMonths) as Date;
- Mark as New
- Bookmark
- Subscribe
- Mute
- Subscribe to RSS Feed
- Permalink
- Report Inappropriate Content
Hello,
I am glad to hear that my suggestion has helped you get on the right path. Since the new issue that you are facing is related to how create an calculated dimension in Data load editor, I would suggest creating a new community post and mention only this issue.
Otherwise, investigating different issues in one post can get messy sometimes, so having them in separate threads will, also, help other community members to provide their input.
I hope that this information is helpful