Unlock a world of possibilities! Login now and discover the exclusive benefits awaiting you.
- Qlik Community
- :
- Forums
- :
- Analytics & AI
- :
- Products & Topics
- :
- App Development
- :
- Exclude total based on current selection
- Subscribe to RSS Feed
- Mark Topic as New
- Mark Topic as Read
- Float this Topic for Current User
- Bookmark
- Subscribe
- Mute
- Printer Friendly Page
- Mark as New
- Bookmark
- Subscribe
- Mute
- Subscribe to RSS Feed
- Permalink
- Report Inappropriate Content
Exclude total based on current selection
Hello,
I have a graph displaying the following facts:
- average age
IF(((GetSelectedCount([Jaar])=0)*(GetSelectedCount([Maand])=0)),
Avg({<Jaar={$(=max(Jaar))},[CM Flag]={'1'}>}Leeftijd),
Avg({<[Jaar-Maand]=P({$<Jaar={$(=max(Jaar))}>}[Jaar-Maand]),Jaar={$(=max(Jaar))}>}Leeftijd))
- average age ignoring the current selection
IF(((GetSelectedCount([Jaar])=0)*(GetSelectedCount([Maand])=0)),
Avg({1<Jaar={$(=max(Jaar))},[CM Flag]={'1'}>}Leeftijd),
Avg({1<[Jaar-Maand]=P({$<Jaar={$(=max(Jaar))}>}[Jaar-Maand]),Jaar={$(=max(Jaar))}>}Leeftijd))
Dimension is RoleGroup, so it shows me the average age per RoleGroup for a particular Location of the company, compared to the average age per RoleGroup based on the entire company. E.g.:
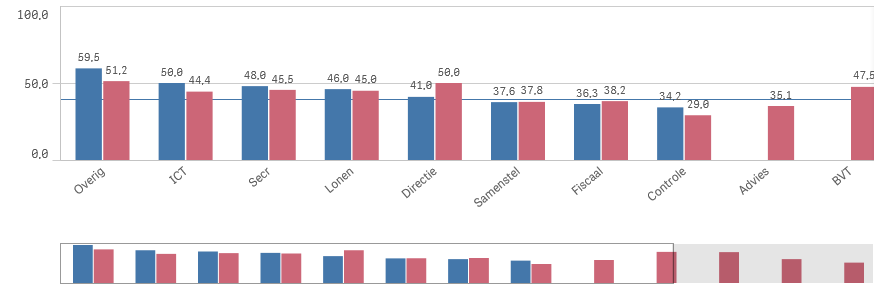
Question:
I want to exclude the red bars in case there is no blue bar present. In this example, I don't want to see the 'Advies' and 'BVT' bars. What would be the best way to achieve that?
Thanks in advance for your help.
- Mark as New
- Bookmark
- Subscribe
- Mute
- Subscribe to RSS Feed
- Permalink
- Report Inappropriate Content
May be like this for average age ignoring the current selection
If(IF(((GetSelectedCount([Jaar])=0)*(GetSelectedCount([Maand])=0)),
Avg({<Jaar={$(=max(Jaar))},[CM Flag]={'1'}>}Leeftijd),
Avg({<[Jaar-Maand]=P({$<Jaar={$(=max(Jaar))}>}[Jaar-Maand]),Jaar={$(=max(Jaar))}>}Leeftijd)) <> 0,
IF(((GetSelectedCount([Jaar])=0)*(GetSelectedCount([Maand])=0)),
Avg({1<Jaar={$(=max(Jaar))},[CM Flag]={'1'}>}Leeftijd),
Avg({1<[Jaar-Maand]=P({$<Jaar={$(=max(Jaar))}>}[Jaar-Maand]),Jaar={$(=max(Jaar))}>}Leeftijd)))