Unlock a world of possibilities! Login now and discover the exclusive benefits awaiting you.
- Qlik Community
- :
- Forums
- :
- Analytics & AI
- :
- Products & Topics
- :
- App Development
- :
- Re: Exclude value in dimension using set analysis
- Subscribe to RSS Feed
- Mark Topic as New
- Mark Topic as Read
- Float this Topic for Current User
- Bookmark
- Subscribe
- Mute
- Printer Friendly Page
- Mark as New
- Bookmark
- Subscribe
- Mute
- Subscribe to RSS Feed
- Permalink
- Report Inappropriate Content
Exclude value in dimension using set analysis
Data Sample:
| Year | Sum (Qty 1) | Sum (Qty 2) |
|---|---|---|
2016 | 1 | 2 |
| 2017 | 2 | 3 |
| 2018 | NULL | 4 |
Formula: Sum (Qty 1)/Sum(Qty 2)
Problem: I'm trying to create a line graph of Year vs [Sum( Qty 1) / Sum( Qty 2)]. The graph looks weird because it drops to 0 in 2018 due to the NULL value in Sum (Qty 1). Is there anyway to get the graph to not display year 2018 because Sum (Qty 1) is Null? How would you code that in set expression?
Any help would be greatly appreciated!!
- Tags:
- set analyses
Accepted Solutions
- Mark as New
- Bookmark
- Subscribe
- Mute
- Subscribe to RSS Feed
- Permalink
- Report Inappropriate Content
Hi Jason,
You can also use : Sum({<Qty1={'*'}>}Qty1) / Sum({<Qty1={'*'}>}Qty2) in order to avoid Null values,
Hope it can help you with your issue,
Regards
Jon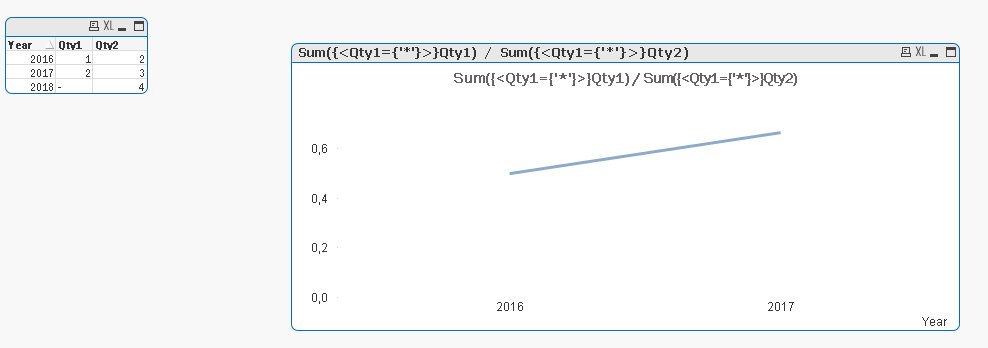
- Mark as New
- Bookmark
- Subscribe
- Mute
- Subscribe to RSS Feed
- Permalink
- Report Inappropriate Content
May be this
Sum({<Year -= {2018}>}Qty 1)/Sum({<Year -= {2018}>}Qty 2)
- Mark as New
- Bookmark
- Subscribe
- Mute
- Subscribe to RSS Feed
- Permalink
- Report Inappropriate Content
Hey Sunny, thanks for the response. That was my first thought, but I was hoping there would be a way that I could avoid hardcoding a specific year to ignore
- Mark as New
- Bookmark
- Subscribe
- Mute
- Subscribe to RSS Feed
- Permalink
- Report Inappropriate Content
May be this
Sum({<Year = {"=Sum(Qty 1) > 0"}>}Qty 1)/Sum({<Year = {"=Sum(Qty 1) > 0"}>}Qty 2)
- Mark as New
- Bookmark
- Subscribe
- Mute
- Subscribe to RSS Feed
- Permalink
- Report Inappropriate Content
Hi Jason,
You can also use : Sum({<Qty1={'*'}>}Qty1) / Sum({<Qty1={'*'}>}Qty2) in order to avoid Null values,
Hope it can help you with your issue,
Regards
Jon
- Mark as New
- Bookmark
- Subscribe
- Mute
- Subscribe to RSS Feed
- Permalink
- Report Inappropriate Content
this worked for me, thanks a bunch!