Unlock a world of possibilities! Login now and discover the exclusive benefits awaiting you.
- Qlik Community
- :
- Forums
- :
- Analytics & AI
- :
- Products & Topics
- :
- App Development
- :
- Expression to use for 'Comparable' Locations
- Subscribe to RSS Feed
- Mark Topic as New
- Mark Topic as Read
- Float this Topic for Current User
- Bookmark
- Subscribe
- Mute
- Printer Friendly Page
- Mark as New
- Bookmark
- Subscribe
- Mute
- Subscribe to RSS Feed
- Permalink
- Report Inappropriate Content
Expression to use for 'Comparable' Locations
Good Morning!
I load data for each of our locations that contains sales performance. It is structured like this:
Unit #
Current Year Sales ("CY TP 13")
Year Ago Sales ("PY TP 13")
From there, I use the following formula to highlight % Change Vs Ya
AVG ([CY TP 13])/avg([PY TP 13])-1
The problem is, I need to create a chart (perhaps a TreeMap), that only displays the data of 'comparable' locations, since some locations that are reporting sales this year weren't open last year, distorting the % change statistic. In other words, I want to calculate locations where PY TP 13>0.
In my example, what would the expression be in the expression editor?
Thanks for any help that can be provided?
- « Previous Replies
-
- 1
- 2
- Next Replies »
Accepted Solutions
- Mark as New
- Bookmark
- Subscribe
- Mute
- Subscribe to RSS Feed
- Permalink
- Report Inappropriate Content
- Mark as New
- Bookmark
- Subscribe
- Mute
- Subscribe to RSS Feed
- Permalink
- Report Inappropriate Content
Check this link out and see if this helps (have not dig deeper, but it seems that this might help you)
- Mark as New
- Bookmark
- Subscribe
- Mute
- Subscribe to RSS Feed
- Permalink
- Report Inappropriate Content
Thanks, Sunny. I think you are on the right track...
So, I created the following following phrase in the script editor:
IF ("PY TP 13" >0, 1, 0) as Comp_Flag
But, now in the Expression editor in the chart, I use this expression, and there is an error somewhere:
AVG [Comp_Flag](([CY TP 13])/avg([PY TP 13])-1)
Do you see anything wrong with my approach or expression?
Many, Many thanks!!
- Mark as New
- Bookmark
- Subscribe
- Mute
- Subscribe to RSS Feed
- Permalink
- Report Inappropriate Content
I am not sure if the flag itself is right or not, but may be you can use it like this:
Avg({<[Comp_Flag] = {1}>} [CY TP 13])/Avg([PY TP 13])-1)
- Mark as New
- Bookmark
- Subscribe
- Mute
- Subscribe to RSS Feed
- Permalink
- Report Inappropriate Content
I think this worked, Sunny. I still need to verify the results, but at least the syntax is correct and it is making the calculations and displaying the graph. I just need to validate the results on this end.
Thanks - have a S U N N Y day! 
- Mark as New
- Bookmark
- Subscribe
- Mute
- Subscribe to RSS Feed
- Permalink
- Report Inappropriate Content
I guess this solution doesn't work after all:
Avg({<[Comp_Flag] = {1}>} [CY TP 13])/Avg([PY TP 13])-1
The % change for a small group of 9 locations I tested gave me incorrect results.....
Can anyone please help me?
Thanks.....
- Mark as New
- Bookmark
- Subscribe
- Mute
- Subscribe to RSS Feed
- Permalink
- Report Inappropriate Content
I am sure willing to, would it be possible to share a sample?
- Mark as New
- Bookmark
- Subscribe
- Mute
- Subscribe to RSS Feed
- Permalink
- Report Inappropriate Content
Sure I will, Sunny. You are so kind again....
The "correct" % change should be +1.9%. In my bar graph, it shows up as 30%+
Let me know if you need anything else.
- Mark as New
- Bookmark
- Subscribe
- Mute
- Subscribe to RSS Feed
- Permalink
- Report Inappropriate Content
And here is what the graph displays when I select the market for that group of locations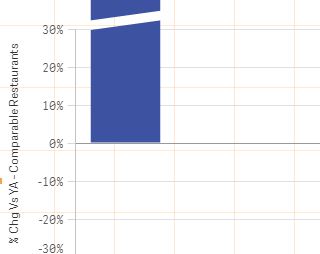 :
:
- Mark as New
- Bookmark
- Subscribe
- Mute
- Subscribe to RSS Feed
- Permalink
- Report Inappropriate Content
How are you calculating 1.9% here? are you doing Average of % Change?
- « Previous Replies
-
- 1
- 2
- Next Replies »