Unlock a world of possibilities! Login now and discover the exclusive benefits awaiting you.
- Qlik Community
- :
- Forums
- :
- Analytics & AI
- :
- Products & Topics
- :
- App Development
- :
- FY YTD Sum
- Subscribe to RSS Feed
- Mark Topic as New
- Mark Topic as Read
- Float this Topic for Current User
- Bookmark
- Subscribe
- Mute
- Printer Friendly Page
- Mark as New
- Bookmark
- Subscribe
- Mute
- Subscribe to RSS Feed
- Permalink
- Report Inappropriate Content
FY YTD Sum
I'm attempting to create a Fiscal Year to date sum but I'm struggling to have my start date recognized by qlik sense.
Our Fiscal Year starts 1 October so I'm trying the following:
```
SUM({$<
my_Date={'>=$(=Date#((Year(Max(my_Date))-1)&''-10-01'', ''YYYY-MM-DD''))<=$(=Max(my_Date))'}>}
my_Value
)
```
But this sums my entire date range until the current date. I created a table to check what was happening
```
'>=$(=Date#((Year(Max(my_Date))-1)&''-10-01'', ''YYYY-MM-DD''))<=$(=Max(my_Date))'
```
Which produces the following:
>=<6/30/2018
Basically, it doesn't create my starting date. However, If I just put
```
=Date#((Year(Max(my_Date))-1)&'-10-01', 'YYYY-MM-DD')
```
i.e. not inside a string literal but just as a measure, the correct date appears.
So I'm not sure why I cannot select the proper start date in my set analysis. The my_Date column is all dates, one a month each at month end.
| idx | Date |
|---|---|
| 1 | 4/30/2018 |
| 2 | 5/31/2018 |
| 3 | 6/30/2018 |
Docs I've been trying to use:
Set Analysis for Rolling Periods
EDIT:
How do I create a Year to Date Measure?
It appears I can do this by month but not if I roll up to the quarter level because the number you move above is incorrect.
- Mark as New
- Bookmark
- Subscribe
- Mute
- Subscribe to RSS Feed
- Permalink
- Report Inappropriate Content
Hi,
try it like this:
SUM({$<
my_Date={'>=$(=Date(Date#((Year(Max(my_Date))-1)&''-10-01'', ''YYYY-MM-DD''),'M/DD/YYYY'))<=$(=Max(my_Date))'}>}
my_Value
)
- Mark as New
- Bookmark
- Subscribe
- Mute
- Subscribe to RSS Feed
- Permalink
- Report Inappropriate Content
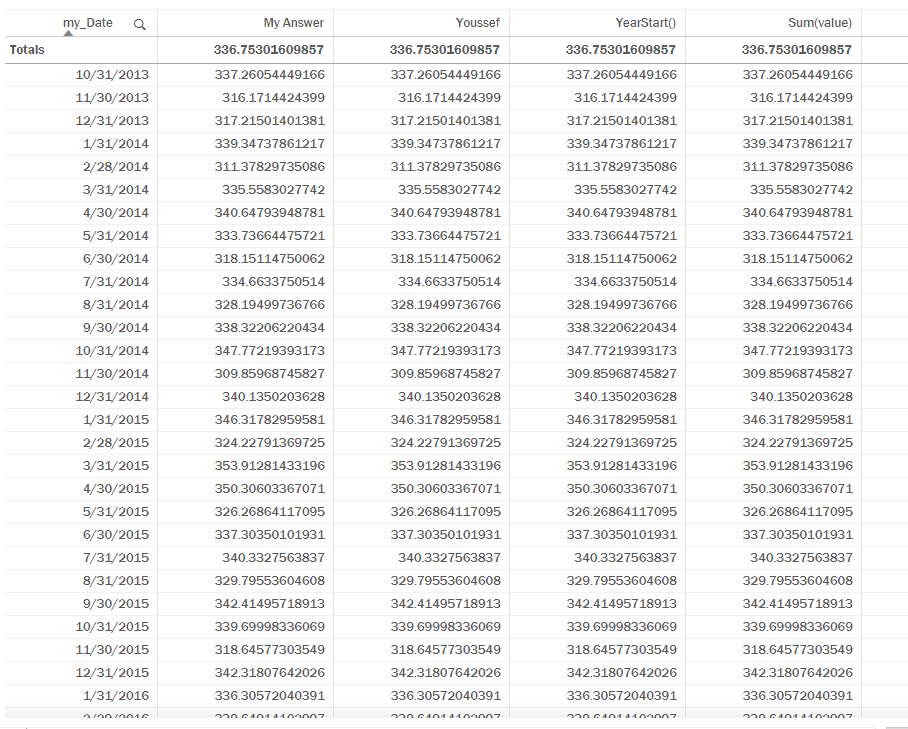
Here are the results fro the following methods:
my Answer:
SUM({$<
my_Metric={'cost'},
my_Metric_Component={'Total Costs'},
my_Service={'food'},
my_Date={'>=$(=Date#((Year(Max(my_Date))-1)&''-10-01'', "YYYY-MM-DD"))<=$(=Max(my_Date))'}>}
my_Value
)
Youssef Answer:
SUM({$<
my_Metric={'cost'},
my_Metric_Component={'Total Costs'},
my_Service={'food'},
my_Date={'>=$(=Date(Date#((Year(Max(my_Date))-1)&''-10-01'', ''YYYY-MM-DD''),`M/DD/YYYY`))<=$(=Max(my_Date))'}>}
my_Value
)
YearStart():
SUM({$<
my_Metric={'cost'},
my_Metric_Component={'Total Costs'},
my_Service={'food'},
my_Date={'>=$(=MIN(YearStart(my_Date, 0, 10)))<=$(=Max(my_Date))'}>}
my_Value
)
Sum(value):
SUM({$<
my_Metric={'cost'},
my_Metric_Component={'Total Costs'},
my_Service={'food'}
>}
my_Value
)
As you can see, no matter what I do with my date column, I always get the same results. In the last one I remove the date filter all together and get the same thing.
- Mark as New
- Bookmark
- Subscribe
- Mute
- Subscribe to RSS Feed
- Permalink
- Report Inappropriate Content
The following solution works if every data point is shown, i.e. no roll-up
IF( month(my_Date) = 10,
Sum({$<my_Service={'food'},my_Metric_Component={'Total Costs'}>}my_Value)
,
RangeSum(Above( Sum({$<my_Service={'food'}, my_Metric_Component={'Total Costs'}>}my_Value) , 0, month(my_Date) - 10 + IF( Month(my_Date) < 10, 13, 1)))
)
However, If I try to show data by Quarter instead of by month this does not work. Partial solution..
- Mark as New
- Bookmark
- Subscribe
- Mute
- Subscribe to RSS Feed
- Permalink
- Report Inappropriate Content
Would you be able to share a QVF file that shows the issue ?
- Mark as New
- Bookmark
- Subscribe
- Mute
- Subscribe to RSS Feed
- Permalink
- Report Inappropriate Content
Please see the attached file.
FYTD Sum v1 appears to work for by month but not by quarter. I'd like something that works for both.