Unlock a world of possibilities! Login now and discover the exclusive benefits awaiting you.
Announcements
Now accepting applications for the Qlik Luminary and Partner Ambassador Programs: Apply by July 6!
- Qlik Community
- :
- Forums
- :
- Analytics & AI
- :
- Products & Topics
- :
- App Development
- :
- Fixed Number Limitation Stacked Bar Chart
Options
- Subscribe to RSS Feed
- Mark Topic as New
- Mark Topic as Read
- Float this Topic for Current User
- Bookmark
- Subscribe
- Mute
- Printer Friendly Page
Turn on suggestions
Auto-suggest helps you quickly narrow down your search results by suggesting possible matches as you type.
Showing results for
Creator III
2019-05-13
05:21 PM
- Mark as New
- Bookmark
- Subscribe
- Mute
- Subscribe to RSS Feed
- Permalink
- Report Inappropriate Content
Fixed Number Limitation Stacked Bar Chart
Hi All,
I seem to be experiencing some strange behavior with the Dimension Limitation and Stacked Bar Chart.
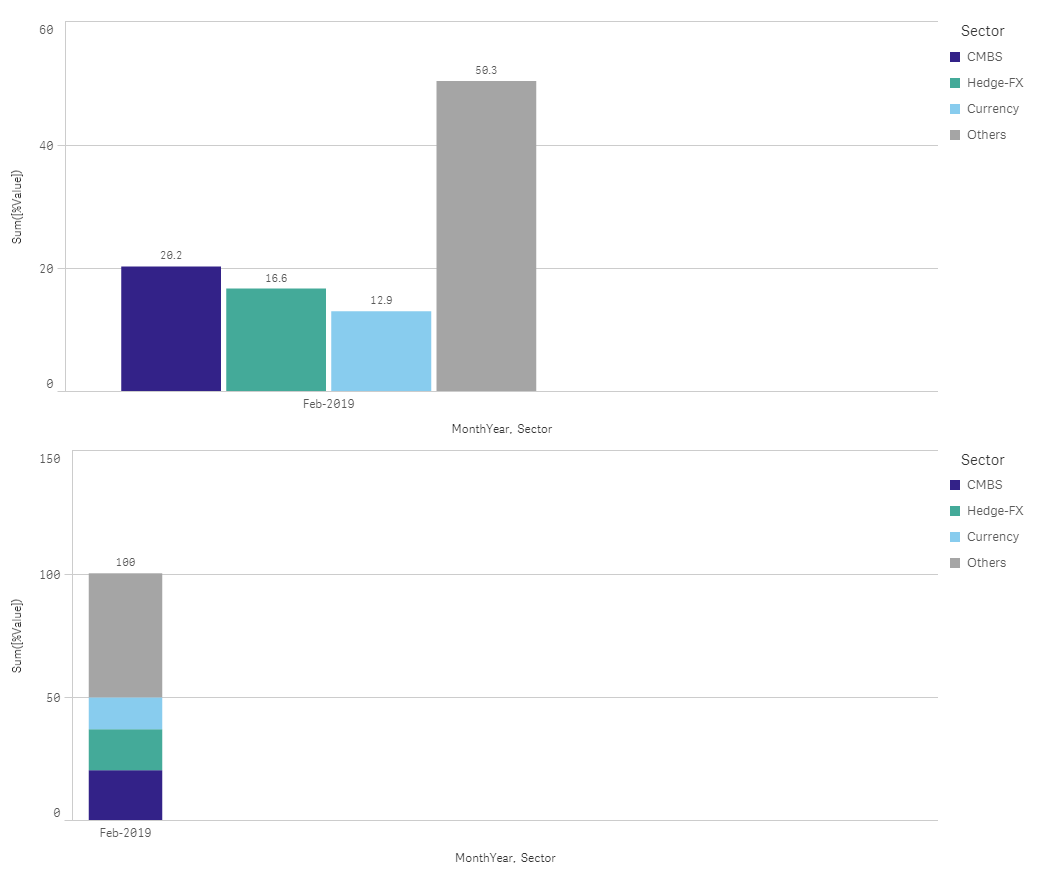
I have the below table. My dimensions are Month Year and Sector and my measures is sum(Fabs(Value))/sum(Total <[Month Year]> Fabs(Value)). In my table I have a dimensional limit on Sector to show Top 4 and others.

If I then drag a bar chart over the table I get the following.

However if I choose to stack my dimensions in the bar chart vs group the calculation is erratic and wrong.

Anyone have any ideas whats happening?
Thanks,
Mark
1,509 Views
2 Replies
Employee
2019-05-14
01:32 AM
- Mark as New
- Bookmark
- Subscribe
- Mute
- Subscribe to RSS Feed
- Permalink
- Report Inappropriate Content
This does appear strange, I can't replicate it, works fine here.
1,492 Views
Employee
2019-05-14
01:33 AM
- Mark as New
- Bookmark
- Subscribe
- Mute
- Subscribe to RSS Feed
- Permalink
- Report Inappropriate Content
1,489 Views