Unlock a world of possibilities! Login now and discover the exclusive benefits awaiting you.
- Qlik Community
- :
- Forums
- :
- Analytics & AI
- :
- Products & Topics
- :
- App Development
- :
- Re: Format Issue in line chart while using 2 diffe...
- Subscribe to RSS Feed
- Mark Topic as New
- Mark Topic as Read
- Float this Topic for Current User
- Bookmark
- Subscribe
- Mute
- Printer Friendly Page
- Mark as New
- Bookmark
- Subscribe
- Mute
- Subscribe to RSS Feed
- Permalink
- Report Inappropriate Content
Format Issue in line chart while using 2 different Variable button functionality
Hi Gurus,
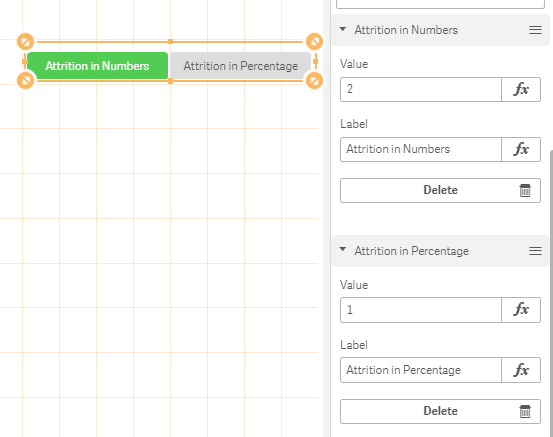
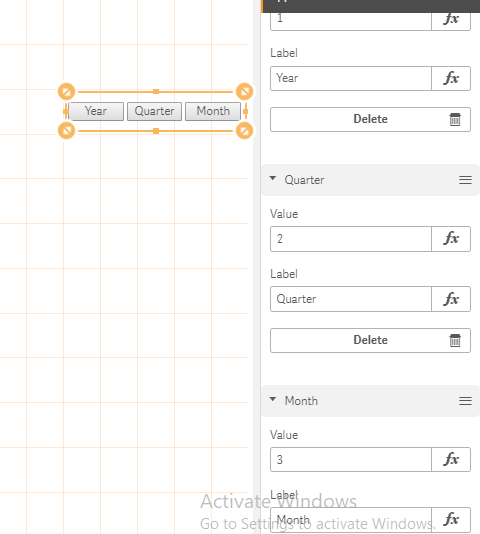
I have a line chart which is associated to two different variable buttons.
I have used "two pick" statements to change the measure values of the line.
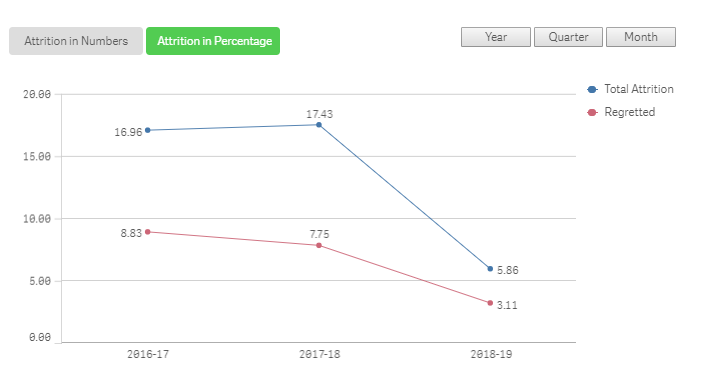
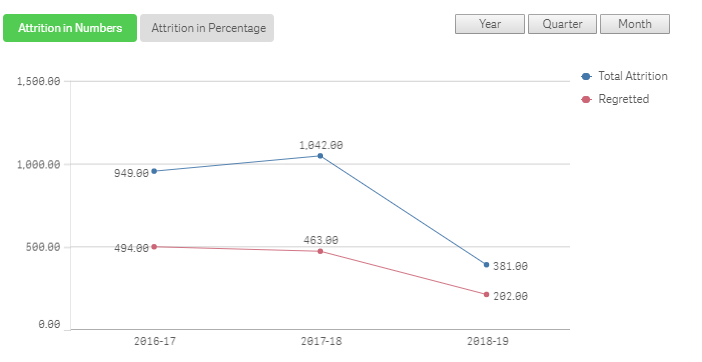
The above figure shows Year wise Attrition in Percentage and Number respectively.
Ex: We need 17.43(two decimal points) values to be shown when we select attrition in percentage.
1042(Without decimal points) to be shown when we select attrition in numbers.
Note: We need to implement this in a single chart.
We have tried to write a set expression so when we click on attrition in numbers, the Number format(num(Measure, '##0')) is written without any decimal points and when we select attrition in percentage, the number format(num(Measure,'##0.00')). But still we are unsuccessful in achieving the result.
The Set analysis written is:
Total attrition:
if(v7=1,Pick(var3,Num(((sum(AttritionHeadCount)) /((Sum(HeadCount)+Sum(HeadCount))/ 2))*100,'0.00'),
sum(AttritionHeadCount)),
if(v7=3,(Pick(var3,Num( ((sum(AttritionHeadCount)) / (Sum(HeadCount)))*100,'0.00'),
sum(AttritionHeadCount))),
Pick(var3,Num(( (sum(AttritionHeadCount)) /((Sum(HeadCount)+ Sum(HeadCount))/ 2))*100,'0.00'),sum(AttritionHeadCount))))
Regretted:
if(v7=1,Pick(var3,Num(( (sum(AttritionHeadCount)) /((Sum(HeadCount)+Sum(HeadCount))/ 2))*100,'0.00'),
sum(AttritionHeadCount)),
if(v7=3,(Pick(var3,Num((sum(AttritionHeadCount)) / ( Sum(HeadCount))*100,'0.00'),
sum(AttritionHeadCount))),
Pick(var3,Num(( (sum(AttritionHeadCount)) /((Sum(HeadCount)+ Sum(HeadCount))/ 2))*100,'0.00'),sum(AttritionHeadCount))))
For further reference:
Note: We cannot use two tables as per application demand.
Please let me know how to achieve the following requirement.
Thanks and Regards
Shree Krishna Dwivedi
- Mark as New
- Bookmark
- Subscribe
- Mute
- Subscribe to RSS Feed
- Permalink
- Report Inappropriate Content
Hi
You could write your two measures with each right format
And without if in expression just make the expression visible according to value of your variable
Regards
- Mark as New
- Bookmark
- Subscribe
- Mute
- Subscribe to RSS Feed
- Permalink
- Report Inappropriate Content
Dear Olivier GAUTIER,
Thanks for your reply and valuable time !!!
Yes,I tried as you have mention.But not able to get desired result.It is working only if i am writing for each individual charts.
Here the requirement is both will be in single chart and result should be like-
Ex: Attrition in Numbers-1004 (without decimal point)
Attrition in percentage- 17.42 (two decimal point)
Geting result- Attrition in percentage- 17.42 (two decimal point)
Attrition in Numbers-1004.00 (with decimal point) <-----Problem
Regards,
Shree Krishna Dwivedi
- Mark as New
- Bookmark
- Subscribe
- Mute
- Subscribe to RSS Feed
- Permalink
- Report Inappropriate Content
Hi,
what I mean is : in each chart you have the two measures (in number and in %), each measure with the right format.
then according to the value of your variable/button each measure is visible or not (property condition),
is this you have allready tested ?
regards
- Mark as New
- Bookmark
- Subscribe
- Mute
- Subscribe to RSS Feed
- Permalink
- Report Inappropriate Content
Hi Olivier,
Sorry for the delay!!!
Yes, I tried as you suggested,But not getting the required result.
As above method i am able to get the result in single single chart,if i am mapping in a single chart both format,result fail.
Thanks for your reply!!!
Regards,
Shree krishna Dwivedi